Using data from https://www.covid19india.org/, as of May 27th 2020, Delhi had recorded 15257 COVID-19 cases and 303 COVID-19 deaths, giving a case fatality rate (CFR) of 2%. The corresponding numbers for Tamil Nadu were 18545 cases and 136 deaths, giving a CFR of about 0.7%.
We use the stochastic, agent-based model previously described (description at /research/modelling-the-covid-19-pandemic/, code at https://github.com/muradbanaji/COVIDSIM) to help compare the evolution of COVID-19 in these two regions.
First, modelling points to the fact that Delhi’s COVID-19 fatalities are unrealistically low. This was observed earlier, and we can try to quantify the effect. We assume (1) a constant case detection rate and (2) a constant infection fatality rate (IFR). The methodology is the same as was previously applied to Maharashtra’s data, where a large discrepancy was found, hard to explain other than via fatality undercounting. When we simulate Delhi’s data, focussed on fitting model predictions and true values of recorded infections, we get plots such as that in Figure 1.
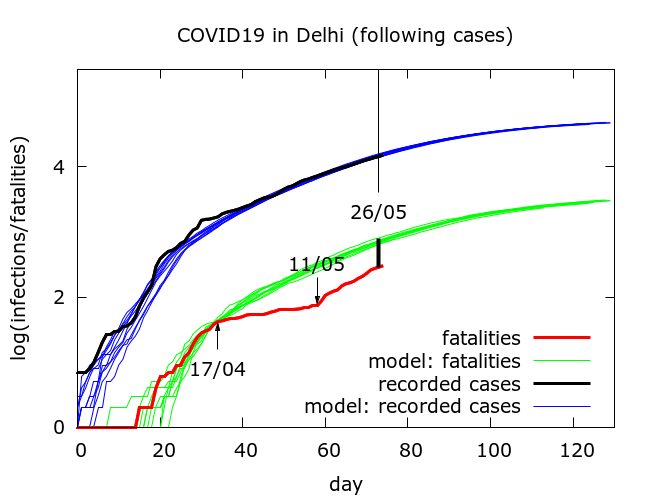
The discrepancy between recorded fatalities (red) and predicted fatalities (green) was discussed earlier. Modelling predicts that based on the recorded infections, upto May 27th, there should have been more than 700 COVID-19 fatalities in Delhi, as against the reported 300 or so. This suggests that fewer than one in two COVID-19 deaths in Delhi have been counted.
When we simulate the data for Tamil Nadu, we get plots like that in Figure 2.
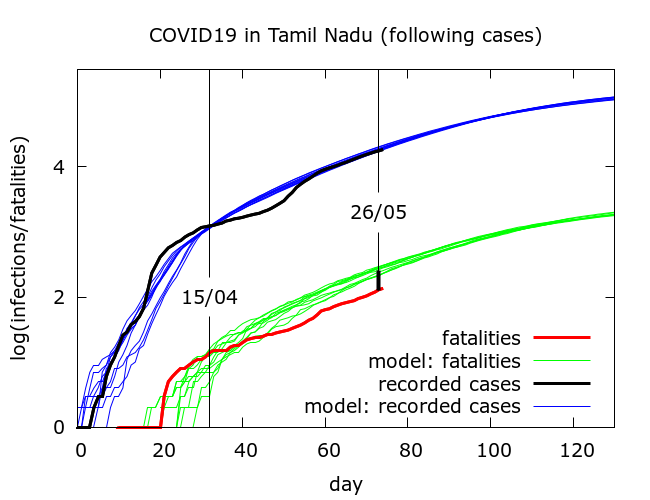
In these simulations, by May 27th the model predicts about 230 deaths, about 75% higher than the observed value of 136.
To what extent could these discrepancies plausibly be explained by increases in case detection? We turn again to data on https://www.covid19india.org/. Between April 15th and May 27th total tests in Delhi went up about 11 times from 16605 to 184362, with reported infections going up about 10 times from 1578 to 15257 – there was thus a slight drop in the test positivity rate from 9.5% to 8.2%. In Tamil Nadu, in the same period, total tests went up about 20 times from 21994 to 442970, with reported infections going up about 15 times from 1242 to 18545. This led to a decrease in test positivity from 5.6% to 4.2%.
Thus increased testing could explain some of the discrepancy between expected and observed fatalities in both regions. Let’s examine this possibility by “trusting” the fatality figures and using these to predict recorded infections based on a constant case detection rate. If we slightly adjust the parameter values used for simulations of the Tamil Nadu data in Figure 2 so as to match the observed fatality data, we now obtain plots like that in Figure 3.
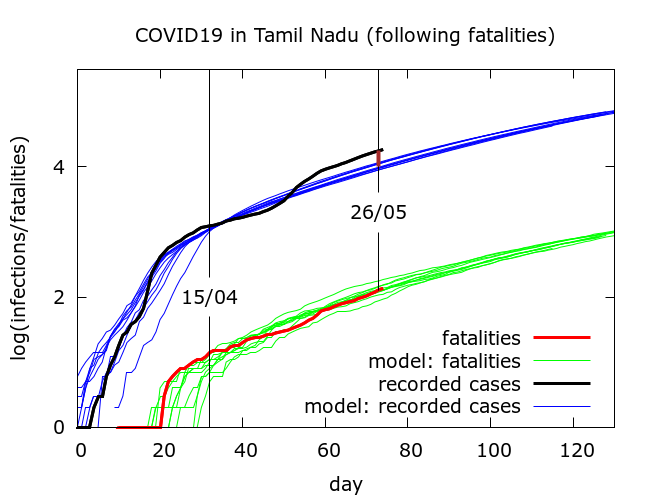
In absolute terms, as of May 27th, we find about 70% more recorded infections than predicted by the model from the fatality data. This would be consistent with a significant increase in case detection. A modest increase in case detection by about 35% would partially explain the discrepancy. If we do the same for Delhi, and “trust” the fatalities we obtain plots like that in Figure 4.
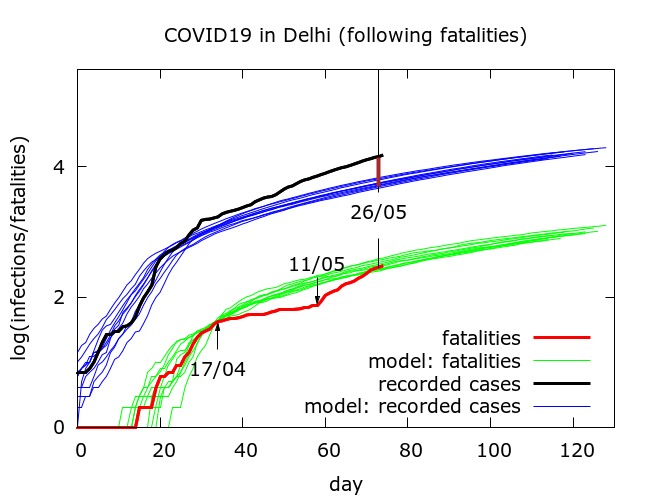
This time, recorded infections on May 27th are almost three times their predicted values. This would imply a massive increase in case detection, which is not consistent with the marginal increase in test positivity. It seems safe to reject this possibility.
To estimate an absolute value for case detection, we assume an IFR of 0.5% for both Delhi and Tamil Nadu. The simulations on which Figures 2 and 3 are based give, to date, a case detection rate of about 16% for Tamil Nadu, while the simulations on which Figures 1 and 4 are based give a case detection rate of about 5% for Delhi.
To summarise – Tamil Nadu’s low COVID-19 fatalities are largely consistent with its recorded infections data coupled with an increase in testing outpacing the rise in infections. There may be some unrecorded deaths, but these do not comprise a very high proportion of the total. In Delhi, on the other hand, modelling suggests that the low level of fatalities is hard to explain without assuming a large number of COVID-19 deaths are going unrecorded. In fact, unrecorded deaths may well comprise more than half of total COVID-19 deaths.
Appendix
Here are the parameter values used to generate Figures 1 and 4.
number_of_runs 10
death_rate 0.5
geometric 1
R0 6.0, 5.5
totdays 150
population 10000000
inf_start 4
inf_end 14
time_to_death 17
dist_on_death 6
time_to_recovery 20
dist_on_recovery 6
time_to_sero 10
dist_on_sero 6
initial_infections 2
herd 1
percentage_quarantined 11
percentage_tested 68
testdate 11
dist_on_testdate 6
haslockdown 1
lockdown_at_test 40
lockdownlen 150
infectible_proportion 0.04
pdeff_lockdown 70, 76
popleak 8000
popleak_start_day 10
physical_distancing 0
pd_at_test N/A
pdeff1 N/A
sync_at_death 42
sync_at_time 34
Here are the parameter values used to generate Figures 2 and 3.
number_of_runs 10
death_rate 0.5
geometric 1
R0 7
totdays 150
population 10000000
inf_start 4
inf_end 14
time_to_death 16
dist_on_death 6
time_to_recovery 20
dist_on_recovery 6
time_to_sero 10
dist_on_sero 6
initial_infections 2
herd 1
percentage_quarantined 30,32
percentage_tested 95,100
testdate 12
dist_on_testdate 6
haslockdown 1
lockdown_at_test 30
lockdownlen 150
infectible_proportion 0.007
pdeff_lockdown 73,77
popleak 8000
popleak_start_day 10
physical_distancing 0
pd_at_test N/A
pdeff1 N/A
sync_at_test 1240
sync_at_time 33,34