Murad Banaji (12/08/2020)
Mumbai’s COVID-19 epidemic could be the largest COVID-19 city epidemic in the world to date. By August 10th an estimated 5 to 6 million people in the city had been infected and there had been 6842 recorded COVID-19 deaths, 15% of the country’s total. Taking into account possible death undercounting, the true toll could be considerably greater. But how did the city get to this point?
Here I’ll attempt to trace Mumbai’s COVID-19 story using a variety of data sources, including data from Mumbai’s serosurvey, news reports and data on cases and fatalities. This process teaches us a number of lessons. It shows us that COVID is not a great leveller and takes very different trajectories in relatively well off areas and poor areas. There are probably no magic bullets when it comes to controlling COVID-19 in urban slums. And it teaches us to be cautious about the stories we spin around data: for example, case numbers in different areas may not accurately reflect the geographical spread of the disease, and fatality rates inferred naively may be very wrong.
The early days of the epidemic
Mumbai recorded its first case of COVID-19 on March 11th and its first COVID-19 death on March 17th. By March 31st, 164 cases and 9 deaths had been reported. Reported cases grew exponentially in late March and early April during the first few weeks of lockdown, quadrupling every week or so, before starting to slow in mid-April. Deaths grew at about the same pace as infections, but then slowed too, rather more dramatically than cases. After the slow-down, cases were doubling roughly every week while deaths were doubling every two weeks or so for a while. We’ll come back to this story.
Nationally and locally, government and media focussed on reported cases and, apart from a few sceptical voices, few questioned whether these reflected the true scale of the disease. But modelling using data now available from Mumbai’s recent seroprevalence study paints a dramatically different picture from recorded case numbers. Using this data along with known features of the disease allows us to track backwards, and this process gives us two findings about the early days.
- It is likely that COVID-19 was circulating in the city by mid-February, almost a month before the first recorded case. There may even have been some infections in the city in January, although this is more speculative. These estimates are drawn from simulations described here. Even without simulation, knowing early doubling times and plausible infection fatality rates derived from the serosurvey data, we can infer when Mumbai’s outbreak likely took off. At the parameter values that we use to simulate Mumbai’s data, it takes on average about 5 introductions to cause an outbreak. We can ask when the critical introduction – the one which actually sets off the outbreak – likely occurred to explain the infection levels later measured. If we track the trajectory of the epidemic in the city using parameters matching what we know about COVID-19, we find a mean and median date of “successful” introduction to be Feb. 10th (45 days before March 25th; 95% CI: 42 to 47 days).
- The simulations give between 70,000 and 1.3 lakh infections in the city by the end of March, with a mere 0.2% of these having been detected by this point. The low early case detection is partly on account of the delay between infection and case detection which magnifies case underdetection during early rapid exponential growth of an epidemic. By varying assumptions on the typical time from infection to case detection, we can, perhaps, reduce the estimated infections in the city to 50,000, but it is hard to go any lower. Thus early detected cases were just the tip of the iceberg.
These estimates tell us that the public and hidden faces of the disease diverged very early on.
Spread in the slums, most of it missed
While many of the earliest cases were reported from housing societies, spread in the slums also began early. The first reported case in Mumbai’s slums was on March 18th, while the first case in Dharavi, Asia’s largest slum, came on April 1st. Dharavi’s first case was also its first death. By May 8th Dharavi accounted for about 7% (808 out of 12,142) of the city’s cases and about 6% (26 out of 462) of the city’s deaths, although these percentages decreased over time. The heavy representation of Dharavi in the numbers decreased after this – by August 6th Dharavi had recorded 2597 cases, just 2.2% of the city’s total cases 250 deaths, about 3.8% of the city’s COVID-19 deaths. In this later data we also see Dharavi’s case fatality rate rising considerably above the city average.
We now know that recorded cases in different areas did not track the levels of infection. Mumbai’s serosurvey data tells us that around 60% of Mumbai’s slum population had been infected by late June as compared to only 17% of those in non-slum areas. (These values take into account the specificity of the antibody test used, and here hence a little higher than the figures quoted in the official report; they do not consider other possible confounding factors.) Thus spread had been highly asymmetric in different localities and particularly rapid in the slums. Although by late June the great majority of infections had occurred in Mumbai’s slums, there was no strong correlation between cases in a given ward and the extent of the slum population in the ward.
These observations suggest that the chances of an infection being detected in the slums were considerably lower than in non-slum areas. This could, in part, have been a consequence of a higher proportion of mild or asymptomatic cases in the younger slum population. But this is unlikely to be the whole story. Dharavi’s relatively high case fatality rate by early August (9.6% based on data here, as against the city average of 5.5%) despite its younger population suggests strongly that disease surveillance in the slums was poorer than in non-slum areas.
Peak and decline in the slums
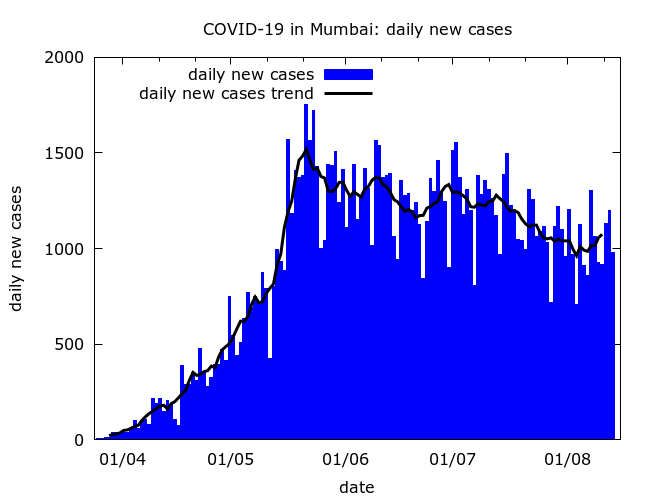
After rising sharply through May and reaching an average of about 1500 on May 22nd, daily new cases in the city started a slow decline.
The city-wide slow-down occurred, no doubt, largely because the disease started to slow in the slums. Considerable public health effort and community participation went into attempts to contain COVID-19 in the slums, judging from the story in Dharavi. With good news stories hard to find during a pandemic, pieces on how COVID-19 had been “contained” in Mumbai’s slums have appeared in the international media including the LA times, the BBC, and the Washington Post.
However, these feel-good stories, present only a partial picture. Based on the serosurvey results, close to half of Mumbai’s slum population may already have been infected by late May when Mumbai’s daily cases peaked. Acquired immunity associated with these high levels of prevalence undoubtedly played a significant part in the slow down in the slums.
Another relevant factor was the migrant exodus. According to official data, an estimated 7 lakh migrant workers left Mumbai during May. Some estimates for the scale of the exodus are even higher. One side effect of the migrant exodus was the spread of disease to other parts of Maharashtra and, indeed, the country. But from Mumbai’s point of view, the resulting reduction in population density was likely an important factor in the slowdown of COVID-19 in the slums. If so, this highlights the foolishness of barring migrant workers from returning home at the start of lockdown when prevalence was relatively low.
Spread in non-slum areas
Given the high prevalence in the slums why has the slow-down in June and July been so slow?
The most likely explanation seems to be that as the decline began in the slums, the disease was still picking up in middle class neighbourhoods where mitigation had more successfully slowed the pace of COVID-19 early on. In these neighbourhoods the “leaky localisation” scenario described in an earlier piece was occurring: lockdown had reduced transmission, but disease was still entering new localities, and new households were becoming vulnerable to infection.
Essentially, Mumbai was experiencing two interlinked epidemics – a rapid one in the slums and a slower one in non-slum areas.
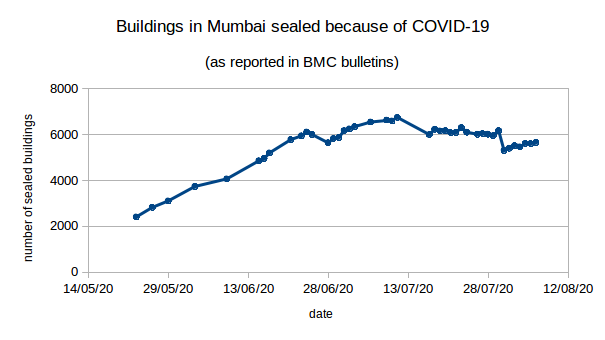
The growth of the non-slum epidemic is evidenced by the steady rise in the number of sealed buildings from about 3000 active sealed buildings at the end of May to over 6000 in early July, with only a very modest decline in this number since then. We’ll see more circumstantial evidence of the shift in spread to non-slum areas when we examine the age-distribution of deaths in the city.
Fatalities and fatality undercounting
The story of Mumbai’s COVID-19 deaths is troubling, to say the least. Even estimating when fatalities peaked is nearly impossible given Mumbai’s story of fatality undercounting and reconciliation.
After early exponential growth, recorded fatalities in Mumbai slowed sharply in mid-April. There was a rapid fall in the city’s case fatality rate (the ratio of fatalities to cases), and modelling indicated an even more dramatic apparent fall in its infection fatality rate (IFR) – the true proportion of those infected who were dying. City officials acknowledged this fall, and their estimates of its scale are consistent with modelling; but they presented it – without evidence – as a victory in the battle against COVID. The fact that this highly implausible official narrative was reported uncritically is a serious failure of scrutiny around pandemic propaganda.
Some part of the explanation for the apparent fall in fatalities may have been a shift in late March from very early spread in housing societies to spread in a younger slum population with consequently fewer fatalities. But this was not all: the drop followed a change in death reporting protocols, and the data had strong signs of an artificial suppression of fatalities. In particular, the very rapid change was hard to explain via only a shift of the disease into new populations.
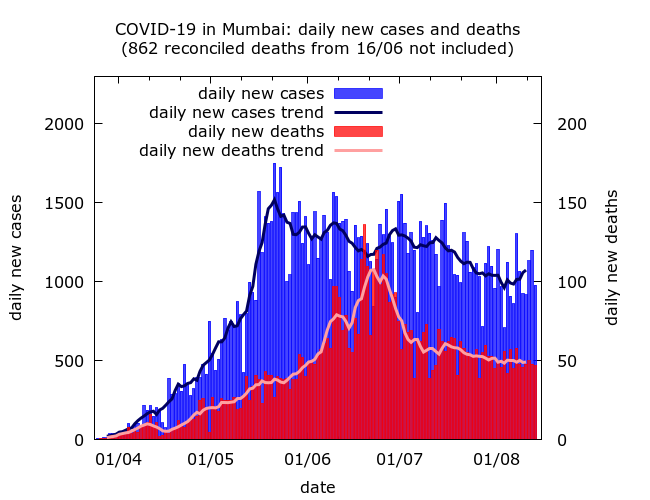
This view was vindicated when, during June, there was a major “reconciliation” and about 1700 “old” fatalities were added into Mumbai’s numbers, 862 on a single day (June 16th). Little explanation was given and, crucially, the added fatalities were not dated. But the scale suggested that fatality undercounting had been highly systematic. Modelling suggests that the reconciliation was incomplete. Until excess mortality figures are made available for careful analysis, the possibility remains that Mumbai has counted only a small part of its COVID-19 fatalities.
One side-effect of the reconciliation was to make tracking COVID-19 deaths in Mumbai much harder. Omitting the single day spike in reconciled deaths on June 16 gives an apparent peak in fatalities in late June, but the true peak was probably earlier and less pronounced. What is clear is that the decline in deaths – like that of cases – has been slow.
Infection fatality rate of COVID-19 in Mumbai
Although Mumbai has recorded more fatalities than any other Indian city, the actual number may appear surprisingly low given the large numbers of infections. After Mumbai’s serosurvey, misleading estimates of 0.05%-0.10% for the IFR of COVID-19 in the city were widely quoted. These both ignored possible death undercounting and were based on data from wards not representative of the city as a whole. As a sanity check, an IFR of 0.05% taken together with the recorded death toll by mid-August would imply that 14 million people – more than the entire population of the city – had been infected with COVID-19!
Although Mumbai has recorded more fatalities than any other Indian city, the actual number may appear surprisingly low given the large numbers of infections. After Mumbai’s serosurvey, misleading estimates of 0.05%-0.10% for the IFR of COVID-19 in the city were widely quoted. These both ignored possible death undercounting and were based on data from wards not representative of the city as a whole. As a sanity check, an IFR of 0.05% taken together with the recorded death toll by mid-August would imply that 14 million people – more than the entire population of the city – had been infected with COVID-19!
Younger people were dying of COVID-19 in Mumbai
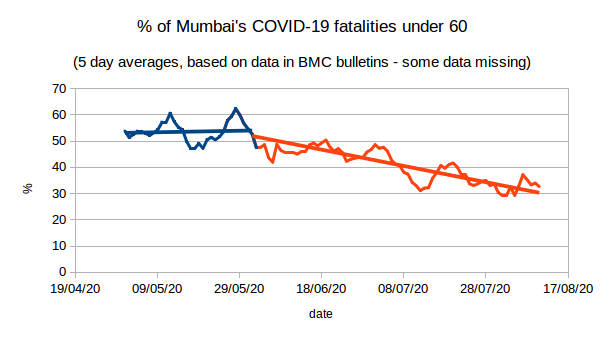
A more careful look at fatality data finds that even without factoring in undercounting a story of “low fatality” is too simple. Going beyond crude values of IFR and examining age groups separately, we find both unexpectedly many fatalities amongst 40 to 60 year olds, and unexpectedly few in the over 70s. By August 10, about 43% of all recorded COVID-19 deaths in Mumbai had been in people under 60. By contrast, the figure for Spain is 5%. Correcting for Mumbai’s younger population we should expect 15 to 20% of Mumbai’s deaths to be occurring in the under-60s, a far greater proportion than in Spain, but nowhere near 43%.
Earlier, this anomaly was even more pronounced: during May, a full 54% of all COVID-19 deaths in the city were in the under-60s. Only in June did this proportion start to decline, approaching 30% in early August. This very pronounced change provides more circumstantial evidence of COVID-19 spreading in a younger (slum) population during April and May, and gradually moving to an older (non-slum) population from June onwards.
But it may also indicate that COVID-19 fatalities were being disproportionately missed in the elderly population of the city with deaths possibly being attributed to other causes or “comorbidities”. At the moment only anecdotal evidence exists for greater death undercounting in the elderly, and the extent to which this might have happened remains to be discovered.
Analysis is complicated by the lack of reliable data on the age structure of Mumbai’s slum and non-slum populations. Mumbai’s age structure is given here, and some data on the age structure in slums using a very small sample is here. But it is extremely likely that Mumbai’s slum population is, on average, considerably younger than its non-slum population. This would be a consequence of the fact that Mumbai’s large migrant worker population resides largely in the city’s slums; and also, of course, of relatively low life expectancy among poorer and more marginalised communities. (Incidentally, Mumbai, as a whole, has considerably lower life expectancy than the national average.)
Conclusions
Mumbai’s data paints a picture of rapid early spread in the slums and slower spread in middle class localities. It appears that as far as the virus was concerned there were two cities, divided along lines of housing poverty. Lockdown almost certainly slowed the disease in housing societies. On the other hand, while causing immense hardship to the poor and migrant workers, it did little to slow disease in their localities.
Of course this is not the whole story. Apart from variation along class lines, there has also been variation along geographical lines. While both slum and non-slum wards in the geographical centre of the city were hard hit early, the fastest growth in cases in early August was in non-slum wards in both the far south and far north of the city.
Mumbai’s epidemic will no doubt continue to wind down slowly. Hopes for a more rapid decline rest on mitigation proving more effective in non-slum areas than in the slums. But the shift in the epidemic to non-slum areas has coincided with the easing of lockdown, and it is not clear how these competing effects will add up.
What does Mumbai’s story teach us?
Firstly, like many other communicable diseases COVID-19 spreads most easily and rapidly in poor quality and high-density housing. If the urban poor are at all protected it is, ironically, because migration and the gap in life expectancy have led to younger populations in slums, which could lower fatality rates. But huge inequalities in access to healthcare and, possibly, long term effects of poverty on health could cancel out this “advantage”. Without granular data on excess mortality broken down by age, occupation and locality, it would be simple-minded to assert that fatality rates amongst the urban poor were lower than amongst the urban middle-classes.
A second lesson is that recorded cases need not track infections, and using case numbers to tell stories about spread may be misleading. The likelihood of getting tested depends in part on class, and as the use of private testing increases, we should expect a growing gap between the detection of infections in marginalised communities versus relatively well-off ones. It is no great surprise, but worth emphasising, that cases are much less likely to be detected in middle class areas than in working class areas.
Thirdly, Mumbai’s data suggests we should treat stories of low fatality rates with scepticism. To make sense of fatality data we need to break it down by age, understand the populations in which disease is spreading, and take possible underreporting into account. When there has been a well-documented story of undercounting, and poor transparency around how this occurred, it would be naive to assume that it is not occurring.
Finally, there are no simple solutions for the control of COVID-19 in urban slums. An intense public health effort was mounted, but ultimately the disease spread rapidly and widely. The effects of skewed urban development, and deep and long-standing inequalities, cannot be reversed through even the most well-meaning short term measures.