(Murad Banaji, 05/06/2020)
A recent Guardian article cast doubts over the accuracy of Russian COVID-19 fatality figures. An earlier article had also noted that “Moscow’s health department revealed that more than 60% of deaths of coronavirus patients in the capital were not tallied in the city’s official death count from the disease because an autopsy showed they had died of other causes.” Thus there is evidence of COVID-19 fatality undercounting in Russia. I wanted to see if modelling supported these claims of fatality underreporting, or whether it gave results consistent with the claim that the relatively low Russian death toll is a consequence of a mass testing regime and rapid response to confirmed cases.
We will use a stochastic, agent-based model described previously at /research/modelling-the-covid-19-pandemic/, with code at https://github.com/muradbanaji/COVIDAGENT. The broad idea is to set parameters to match the Russian recorded COVID-19 infections data, and also fatality data from the early part of the epidemic, namely upto about mid-April. Recorded infections data is modelled by assuming that a constant fraction of cases are detected and that the moment of detection is distributed symmetrically around some fixed day in the disease cycle.
Before we turn to modelling, note that all data for the Russian COVID-19 epidemic is from the associated Wikipedia page. There is also some patchy testing data given on this page. Testing is generally quite high with over 10M tests to date. However it does not appear to have kept pace with infection. According to this testing data, about 1% of tests carried out upto April 9th were positive; this test positivity rate rose and then flattened in mid-May at about 4% (the latest available figure is 3.9%). The trend in test positivity does not suggest that there has been a significant increase in case detection – rather it suggests that case detection has fallen since early-April (but stabilised).
Scenario 1. Our first attempt to fit the testing data and early fatality data (mid-March to early April) resulted in a parameter set which we term “Scenario 1”. The results of simulations of Scenario 1 are plotted in Figure 1 along with the testing and fatality data. The full parameter set for this scenario is given in the Appendix.
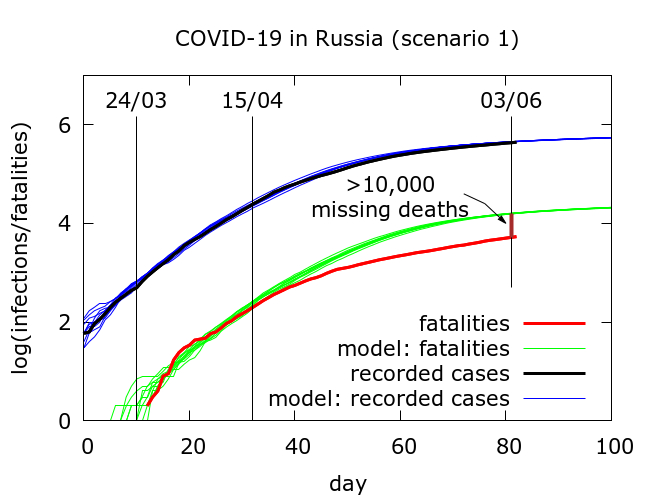
In Scenario 1, infections are tested, on average, on day 8 of the disease cycle, while death occurs, on average, on day 17. There is thus a typical delay of 9 days between testing data and fatality data. As in all our modelling, mitigation works by physical distancing and disease localisation leading to the observed gradual stabilisation of the recorded infections data.
What we find in Scenario 1 is that beginning around early-mid April there is a consistent divergence between expected (green) and observed (red) COVID-19 fatalities. As of June 3rd there have been a little over 10,000 “missing” deaths. Two explanations come to mind for the divergence between red and green curves.
- IFR in Russia has dropped to a third of its early-April value (this would be a surprise during an epidemic).
- quite a large proportion of COVID-19 deaths are not being counted in the official figures – about 2 in 3 deaths are being missed to be precise.
Scenario 2. We can alternatively attempt to set model parameters to reproduce the fatality data, this time, however, underestimating observed infections data, in similar vein to what I did for Delhi and Tamil Nadu in this piece. This scenario corresponds to much more successful mitigation, occurring simultaneously with increased case detection. We have not included this scenario since it is not supported by the rising test positivity.
Scenario 3 – optimistic. Based on experience that it is often possible to reproduce early outbreak data by assuming higher but later case detection, we obtained parameters which resulted in the simulations plotted in Figure 2. The full parameter set for this simulation is given in the Appendix, but the key points are that mitigation has a stronger effect, and testing now occurs, on average, on day 12 in the disease cycle, meaning that, on average, testing picks up the typical infection only 5 days before it would progress to death. Compensating for this late detection is higher detection (the precise numbers depend on the assumed infection fatality rate).
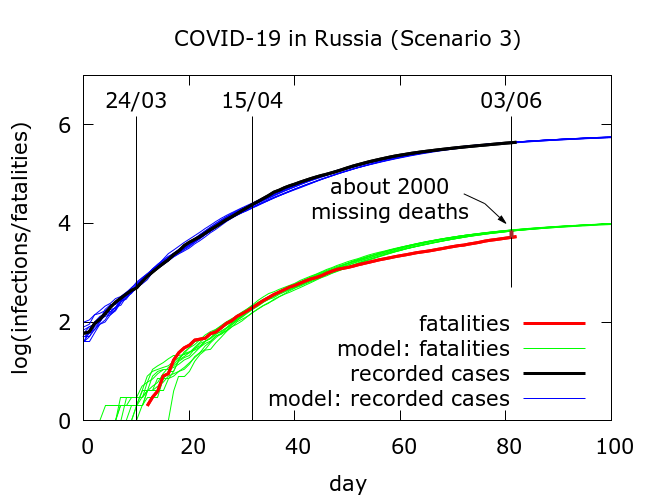
In this “optimistic” simulation, only a relatively small number of deaths (about 2000) have been missed in testing to date.
Is it possible to decide which out of “Scenario 1” and “Scenario 3” is closer to the truth? One crude, but simple, way is to examine the correlations between daily new deaths and daily new infections in the data. We took five blocks of daily fatality data, each 30 days long, beginning, respectively, on April 2nd, 7th, 12th, 17th and 22nd, and examined the correlations between these data-sets and daily new cases data from n days previously where n varied from 0 to 13. The outcomes are shown in Figure 3. We see the maximum correlation occurring with a delay of 10 days, although there also appears to be a more minor peak at a delay of around 5 days.
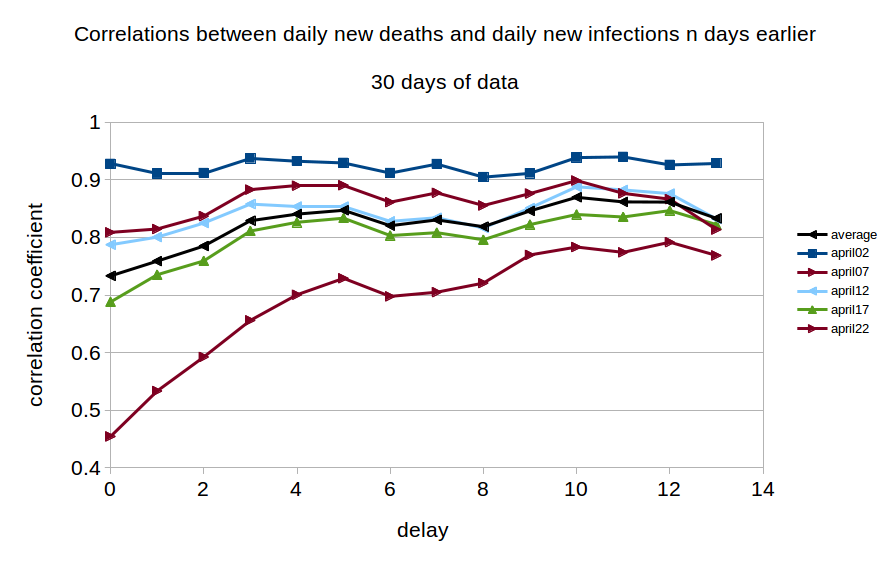
The existence of this long range correlation in the data broadly supports the parameter value assumptions in Scenario 1, namely that reporting of confirmed infections is on average happening considerably earlier in the disease cycle than reporting of deaths. Thus fatality data from today is most closely correlated with infections data from about 10 days ago.
Conclusions. Although it is not possible to come to any very firm conclusions, considering
- the likely fall in case detection indicated by increasing test positivity,
- a fairly clear narrative of discounting deaths of people with comorbidities, and
- a fairly strong correlation between fatality data and testing data from about 10 days previously,
it seems that the estimate in Scenario 1 of about 10,000 missing deaths is likely to be closer to the truth than the relatively optimistic estimate of only 2000 missing deaths. Indeed, if we increased the delay between case recording and death recording, and factored in the likely decrease in case detection, the true figure for missing COVID-19 fatalities in Russia could be considerably higher than 10,000.
Appendix: parameter values used in the simulations
Parameters are given for Scenario 1 and Scenario 3, in that order.
number_of_runs 10
death_rate 5.0
geometric 1
R0 5.5
totdays 150
inf_start 3
inf_end 14
time_to_death 17
dist_on_death 6
time_to_recovery 20
dist_on_recovery 6
initial_infections 10
percentage_quarantined 20,33.5
percentage_tested 60,80
testdate 8,12
dist_on_testdate 6
herd 1
population 12000000
physical_distancing 1
pd_at_test 10
pdeff1 28,38
haslockdown 1
lockdownlen 150
infectible_proportion 0.023,0.0125
lockdown_at_test 183
pdeff_lockdown 48,58
popleak 8000,4000
popleak_start_day 25
sync_at_test 100
sync_at_time 13