(Murad Banaji, 18/08/2020)
After Delhi, Ahmedabad and Mumbai, Pune is the fourth major Indian city to report the results of a seroprevalence survey aimed at detecting the presence of IgG antibodies to SARS-CoV2, the virus responsible for COVID-19. Pune’s survey reported higher prevalence values than any of the other surveys. Although smaller than the surveys in the other three cities, and harder to interpret because of choices of methodology, Pune’s survey nevertheless provides valuable insights into COVID-19 in the city.
Between July 20 and August 5 2020 the serosurvey was carried out in 5 of the 41 wards in the city. 1664 individuals were tested, of whom 51.5% tested positive. These values were not adjusted for sensitivity of the test. Adjusting for sensitivity and specificity of the test (given as 84.7% and 100% respectively in the survey report) would give a higher prevalence of 60.8%. The survey reports is here.
According to news reports, the participants were aged 18 and over, but were chosen from wards where the infection was in high prevalence. According to the map here, four of the five wards are clustered together geographically. So, it is not clear whether these wards are representative of the city as a whole.
The effects of housing poverty
As in Mumbai, seropositivity was found to vary considerably with the kind of dwelling – but the differences were perhaps less stark than in Mumbai. Raw seroprevalence ranged from 62% in “hutments” down to 33% in “apartments”. Shared toilets were a good predictor of high seropositivity, although this does not, of course, imply direct causation. Raw seropositivity amongst those with shared toilets was 62.3% (corrected value: 73.5%) as against 45.3% (corrected value: 53.5%) amongst those with independent toilets. Housing poverty thus appears strongly as a factor in the rapid spread of COVID-19.
At the 2011 census, the population of Pune in 2011 was 3,124,458. At a rate of growth of 3.8% per decade (given here), this would amount to about 3.35 million today. An estimated 36-40% of the city live in slums (estimates here and here). We can take the figures of 62.3% (73.5%) and 45.3% (53.5%) to represent seropositivity in slum and non-slum areas respectively. Indeed they are almost identical to the values obtained from the serosurvey report if we read “hutments” as slums and all other dwellings as non-slum areas.
Estimated seroprevalence in the city as whole
Using the higher figure of 40% residing in slums, this gives an estimated raw seroprevalence in the city of 52.1% (0.623*0.4 + 0.453*0.6 = 0.521) and a corrected prevalence of an astonishing 61.5% (0.735*0.4 + 0.535*0.6 = 0.615).
However, given that the wards were chosen precisely because they were high incidence wards it seems likely that the methodology led to overestimation of prevalence in the city as a whole. In particular, Lohiya Nagar, the ward where the highest incidence was found has been termed, by Pune’s mayor, “the Dharavi of Pune”. Further, we know from Mumbai that cases do not necessarily reflect prevalence in different areas of the city, and that the disease can spread through different geographical areas unevenly over time.
COVID-19 infection fatality rate (IFR) in the city
Despite these reservations, we can suppose that the prevalence inferred from the five wards surveyed does indeed represent prevalence in the city, and explore what this would imply about the IFR of COVID-19 in the city. If, indeed, the city had a COVID-19 seroprevalence of 61.5% at the time of the survey this would give 2.06 million infected people in the city by mid July. With 1744 COVID-19 deaths in Pune city by August 9, we get a very rough naive infection fatality rate (IFR) of 1744/20600 = 0.08% for the city. Note that this naive IFR ignores possible fatality undercounting and relies on the assumption that the prevalence amongst slum and non-slum areas in the city as a whole is captured in the wards surveyed.
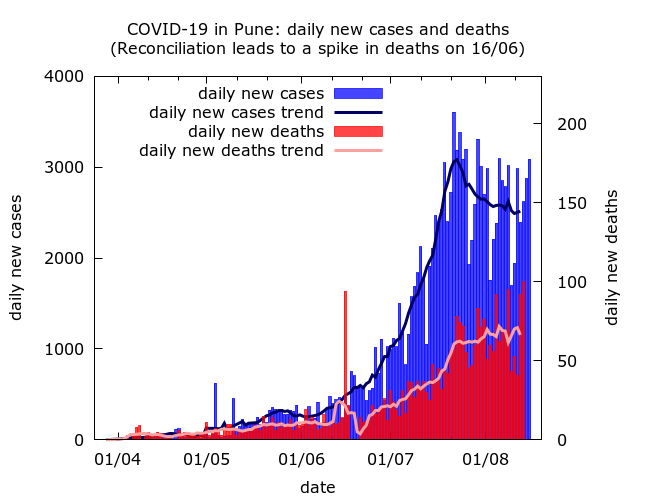
Is there COVID-19 fatality undercounting in Pune? Data available for Pune district (not Pune city) at https://www.covid19india.org/ shows a very marked and steady fall in the cumulative case fatality rate, alongside a fairly steady rise in the cumulative test positivity rate throughout the duration of the epidemic. Pune city accounts for about two thirds of cases and deaths in the district, so we can presume that these trends hold in the city too.
The combination of falling CFR and no evidence of better detection of infections can be a sign of increasing death undercounting. To go a bit further, and suggest values of IFR consistent with the whole trajectory of Pune’s epidemic, we use agent-based modelling.
Data at https://www.covid19india.org/ is given for Pune district, rather than the city. Pune district had a population of 9,429,408 at the 2011 census, and is currently estimated to have a population of 11.1 million, so is considerably larger than the city alone. On the other hand, prevalence in the city appears to be much higher than in the rest of the district on average: on August 9, Pune city accounted for 69,500 out of 1,05,523 COVID-19 cases (66%) in Pune district, and 1744 out of 2639 (66%) COVID-19 deaths in the district. So, we assume that Pune city accounted for two thirds of infections in the district at the time of the serosurvey. This would put seroprevalence in the district at approximately 3.1 million by the survey mid-point (July 28).
We model the trajectory of COVID-19 in the district and obtain IFR values consistent with the trajectory of the epidemic that are considerably higher than the naive one. The methodology, assumptions, and limitations, of the modelling approach have been previously described in a similar discussion for Mumbai. Two example simulations are shown, which can be seen as two ends of a spectrum of possibilities.
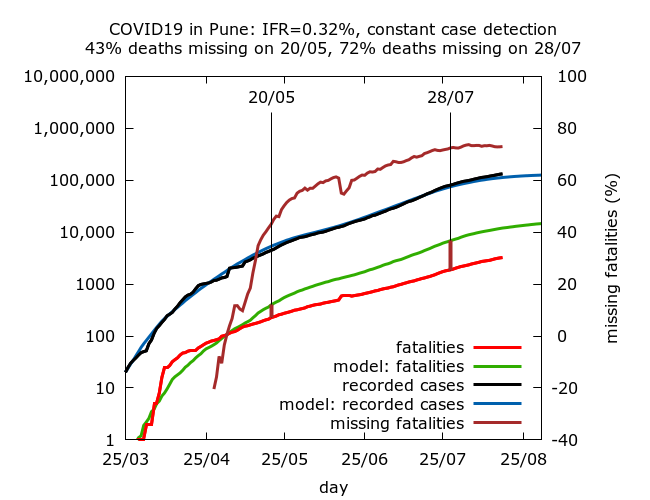
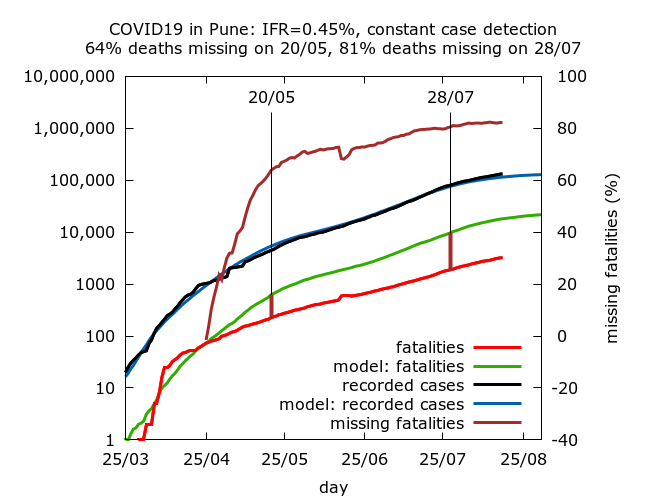
We find that values of IFR consistent with the seroprevalence observed in late July range between 0.32% and 0.45%, with approximately 70-80% of COVID-19 fatalities “missing” by the end of July. This can be interpreted either as a very significant drop in IFR in the district, or increasing death undercounting over time. The simulations suggest that however we interpret the data, much of the drop happened during May, with more gradual change since then. Something dramatic is going on in Pune district when it comes to fatalities.
Summary
Pune city has experienced very rapid and wide spread of COVID-19. Using data for Pune district, it is currently unclear whether the epidemic has peaked or not.
As in Mumbai, the speed of the spread has been strongly correlated with housing conditions: estimated prevalence is about 20% higher in the slums than in non-slum areas. While the naive IFR in the city appears only to be 0.08%, the survey, being based in high prevalence wards, quite likely exaggerated prevalence estimates, and hence lowered this estimate.
Simulations of the whole trajectory of the epidemic in Pune district suggest IFR values of 30% or more, considerably higher than the naive value for Pune city. Thus it appears that the district – and likely the city – has experienced what appears to be a very dramatic drop in its IFR during the course of the epidemic. This could be interpreted as a genuine drop in IFR resulting, possibly, from disease spreading in a younger population, or from improved treatment. Alternatively, there has been very significant and growing fatality undercounting. A combination of the two effects is likely. Without excess mortality data, it is hard to decide where the truth lies.
Technical details of the simulations in the order in which they appear.
Data for cases and deaths in Pune district from April 26 onwards is taken from https://www.covid19india.org/. Earlier data is taken from newspaper reports or extrapolated where a figure could not be found.
IFR is fixed in advance in the simulations, so there are no confidence intervals on IFR – rather 95% CIs are given for the levels of missing deaths on May 20 and on August 7 in each set of simulations. Each row in the table below is based on between 7 and 8 simulations (because of stochastic fluctuations, some epidemics naturally died out). Parameters were varied using trial and error until the estimated seroprevalence for the district lay within the 95% CI for seroprevalence on July 28 given by model simulations. All values are given to 1 d.p.
| IFR | Missing deaths (20/05) | Missing deaths (28/07) |
| 0.32% | 43.0% (39.2%, 46.4%) | 72.4% (70.4%, 74.2%) |
| 0.45% | 63.8% (60.9%, 66.4%) | 80.5% (78.6%, 82.2%) |
Parameter values for the simulations (in the order in which they appear):
These simulations use a new version of the model, termed version 0.2, available on the model github site.
number_of_runs 10
death_rate 0.32, 0.45
geometric -1
R0 2.7
infshp 0.1
totdays 250
inf_gam 1
inf_mid 5.2
inf_tm_shp 9
inf_start 2
inf_end 9
time_to_death 21
dist_on_death -3
time_to_recovery 20
dist_on_recovery -2
initial_infections 10
percentage_quarantined 7.4
percentage_tested 33
testdate 18, 12
dist_on_testdate -3
time_to_sero 14
dist_on_sero -3
herd 1
population 3000000
physical_distancing 1
pd_at_inf 500
pdeff1 20
haslockdown 1
lockdownlen 250
infectible_proportion 0.29
lockdown_at_inf 4000
pdeff_lockdown 43, 42
popleak 250000
popleak_start_day 61
popleak_end_day 94
sync_at_test 2050
sync_at_time 41
ppppppp