(Murad Banaji, 24/07/2020. The original version – based on lower seroprevalence estimates – is here.)
Background. The results of a COVID-19 serosurvey carried out in Delhi between June 27th and July 5th have recently been reported. In the survey 22,823 samples from residents of Delhi were collected and tested for IgG antibodies to SARS-CoV2. Some initial reports suggested that about 10% of samples were found to be positive, while others reported 15% positivity. The figure eventually reported was 23%. An earlier version of this document is here, with a more complete set of simulations based on 10% seropositivity.
Assumptions and their possible effects. In the following calculations, 23% is taken to be the value of seropositivity in Delhi on July 1st after correction to take into account the sensitivity and specificity of the test. As an aside: the raw percentage of positive samples quoted was 23.48%, and given the test sensitivity and specificity quoted as 92.1% and 97.7% respectively, one should get a corrected value of 23.6%; the corrected value quoted in the press conference was, however, 22.86% – a small, but unexplained discrepancy (thanks to @anupampom for pointing this out). In any case such differences are well within the general margins of error on all the estimates.
Delhi’s (i.e., NCT’s) population is taken to be 19 million based on UIDAI figures, although the true value could be higher – if the true population is higher then this would reduce IFR estimates. For simplicity, it is assumed that all seroprevalence data was gathered on July 1st. This could lead to slight underestimation of IFR values, especially if the majority of samples were collected in the later days of the survey. On average, IgG seroconversion is assumed to occur on day 14 after infection (normally distributed with a standard deviation of 2 days). In the simulations the average time between infection and death recording is taken to be 21 days (normally distributed with a standard deviation of 3 days).
Naive estimation. First of all, let’s look at a naive calculation, which is close to the lower estimate given by modelling approaches. Suppose we assume a time from infection to seroconversion of 14 days, a time from infection to death of 21 days, and also that assume that all COVID-19 fatalities had been recorded by July 8th. Then we can examine the number of fatalities recorded in Delhi on July 8th (namely, 3213), as a proportion of the total assumed infections on June 16th (23% of 19 million, namely 14.37 million) to get an infection fatality rate of 0.07%.
Fatality undercounting. Before turning to modelling, let’s recall the story of Delhi’s missing fatalities. In early May a serious mismatch was noted between hospital data on COVID-19 fatalities and the Delhi government’s official figures. Around May 11th a data reconciliation process began which appears – as far as the data is concerned – to have ended around June 16th. Examined with hindsight, the data suggests that a minimum of 75% of all Delhi’s COVID-19 fatalities were missing around May 11th. This minimum estimate is based on the assumption that all fatalities were indeed added back into the official count by mid-June, and even with this assumption we generally get higher estimates of over 80%. It would be fair to call counting only 1 in 4 fatalities very significant fatality undercounting.
Modelling suggests that the data reconciliation considerably brought down the fatality undercounting. But, it is unclear if the reconciliation was “complete” in the sense that there was a point by which there were no missing fatalities. Agent based modelling shows that the data is consistent with complete reconciliation but also with further missing deaths.
Full reconciliation. The most optimistic possibility is that all missing fatalities were indeed added into the official count by June 16th which seems to be the end of the reconciliation, and that fatality data remained accurate after this. Simulation of such a scenario is shown below.
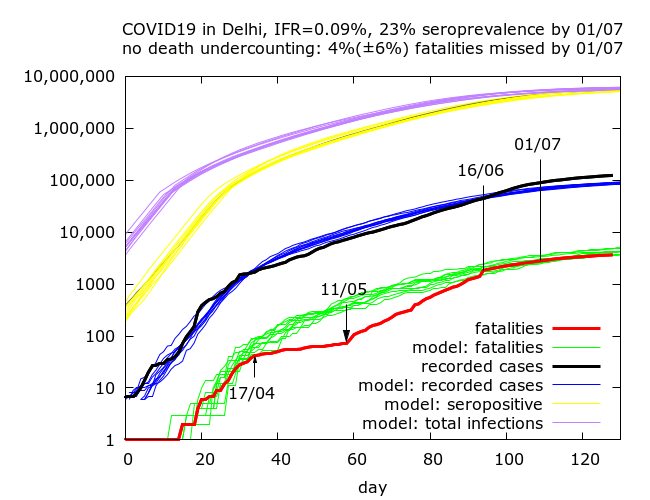
We get an IFR estimate of 0.09%, close to the naive estimate. What this means is that IFR of 0.09% is consistent with this scenario and allows us to reproduce the fatality data reasonably well, bearing in mind the missing deaths added back between 11/05 to 16/06. Note that this scenario also tells us that on May 11th, when Delhi’s fatality undercounting was at its worst, about 82% of all COVID-19 fatalities were missing from the figures.
Incomplete reconciliation by mid-June. The the next two simulations assume that the fatality reconciliation was never complete and even in mid-June some COVID-19 fatalities were missing from Delhi’s official count. We get IFR values of 0.15% and 0.25% corresponding to fatality undercounting (on July 1st) of 38% and 67%.
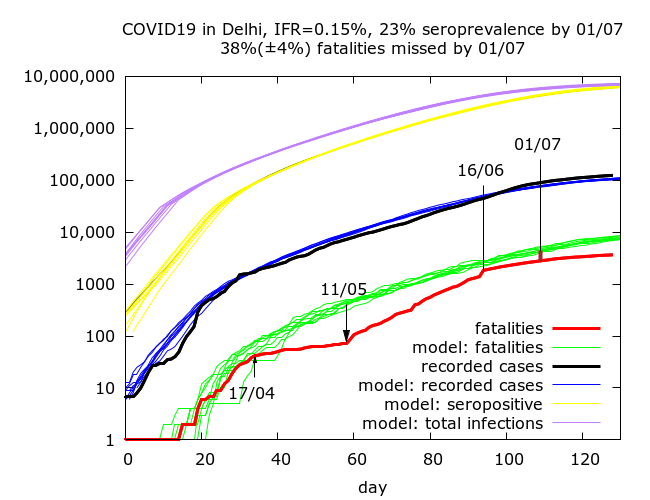
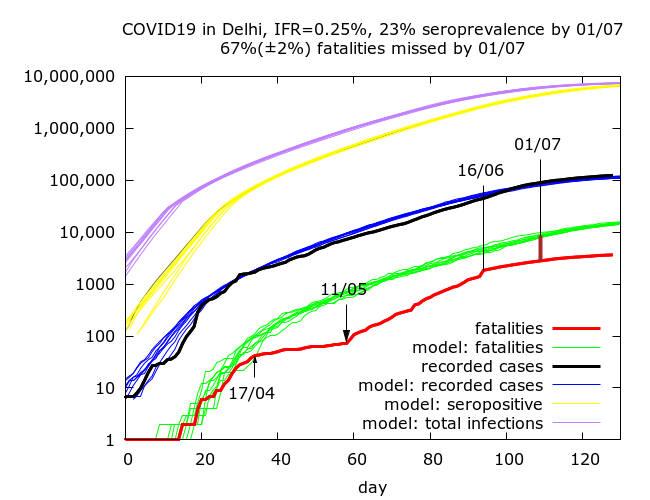
These simulations also give fatality undercounting at the worst point (May 11th) of 83% and 89% respectively. If we allow higher levels of fatality undercounting then we get higher IFR values.
The three simulations shown above correspond to COVID-19 prevalence (not seroprevalence) estimates on July 21st of 31%, 37% and 39% respectively.
Summary. To summarise, the data gives rise to plausible IFR estimates of between 0.09% (no missing fatalities) and 0.25% (2/3 fatalities missed on July 1st) with higher IFR estimates possible but requiring higher levels of fatality undercounting. All of these figures are surprisingly low. They rely on the sensitivity of the test being high and not picking up too many individuals with antibodies for, say, Dengue.
Where does the true figure lie? Given that in the most optimistic scenario presented above (full fatality reconciliation by June 16th) there was a point (around May 11th) when Delhi was missing about 80% of it’s total fatalities, it is not wild to suggest that more than 2/3 of Delhi’s fatalities might be missing today pushing IFR above 0.25%.
Anupam Singh has calculated based on age-structured IFR data from a Spanish serosurvey adjusted for Indian age-structure that IFR in India should be around 0.16%, although it is possible that right-censoring in analysis of the Spanish data (i.e., not taking into account fatalities which were yet to occur at the time of the survey) led to underestimation of IFR. In any case, if the figure of 0.16% were correct it would correspond to fatality undercounting of about 40%, namely 2 in 5 deaths missed in Delhi by early July.
Based on the data available at the moment I would put a best guess IFR between 0.15% and 0.25%, without really hoping to be more precise.
Technical details of the simulations in the order in which they appear. Note that IFR is fixed in advance in the simulations, so there are no confidence intervals on IFR – rather 95% CIs are given for the levels of fatality undercounting and seroprevalence on July 1st in each set of simulations. Each row in the table below is based on between nine and twelve simulations (because of stochastic fluctuations, some epidemics naturally died out). Parameters were varied using trial and error until a value of 23.0% lay within the 95% CI for seroprevalence on July 1st. All values are given to 1 d.p.
| IFR | Fatality undercounting | Seroprevalence |
| 0.09% | 4.4% (-3.3%, 10.9%) | 22.7% (22.0%, 23.3%) |
| 0.15% | 38.4% (34.5%, 41.9%) | 22.7% (22.3%, 23.1%) |
| 0.25% | 67.1% (65.5%, 68.5%) | 23.4% (23.0%, 23.9%) |
Parameter values for the simulations (in the order in which they appear):
(Note that these simulations use a new version of the model, soon to be uploaded on the model github site. The main changes involve the use of more reasonable distributions on key parameters, including the individual R0 values. Behaviour of the model at high prevalence is not much affected.)
number_of_runs 12, 10, 10
death_rate 0.09, 0.15, 0.25
geometric -1
infshp 0.1 //dispersion
R0 2.8, 2.8, 2.85
totdays 180, 200, 200
scale_at_infs 50000
inf_gam 0
inf_start 2
inf_end 9
time_to_death 21
dist_on_death -3
time_to_recovery 20
dist_on_recovery -2
time_to_sero 14
dist_on_sero -2
initial_infections 10
percentage_quarantined 11
percentage_tested 15
testdate 17, 11, 9
dist_on_testdate -3
herd 1
population 10000000
physical_distancing 0
pd_at_test N/A
pdeff1 N/A
haslockdown 1
lockdownlen 180, 200, 200
infectible_proportion 0.31, 0.31, 0.3
lockdown_at_test 35, 65, 85
pdeff_lockdown 50, 49, 49
popleak 220000, 250000, 250000
popleak_start_day 18
popleak_end_day 61, 66, 67
sync_at_test 1640
sync_at_time 33
syncout 109