(Murad Banaji)
Aims and approach. Some simulations are presented of the dynamics of COVID-19 in London using data at https://en.wikipedia.org/wiki/COVID-19_pandemic_in_London up to May 15th 2020. This data is taken at face value. Corrections to the fatality figures in particular would lead to corresponding corrections to all claims below. The motivation was to explore claims made in an article in the London Evening Standard being used to justify the easing of lockdown. These claims were based, apparently, on some modelling results. On closer examination, I found that my modelling results agreed with some of the claims, but found some too optimistic. I think I also uncovered an error/typo where one quantity increased by a factor of 10.
Stochastic, agent-based modelling was used. The modelling is described at /research/modelling-the-covid-19-pandemic/ and open source code is at https://github.com/muradbanaji/COVIDSIM. In Figure 1 we show nine simulations each of which matches the data well, but where the fatality rate varies from 0.4% to 1.0% leading to a range of values for total and current infections. The full sets of parameter values used to generate the plots in Figure 1 are given in the Appendix. They can be understood along with the model code on github.
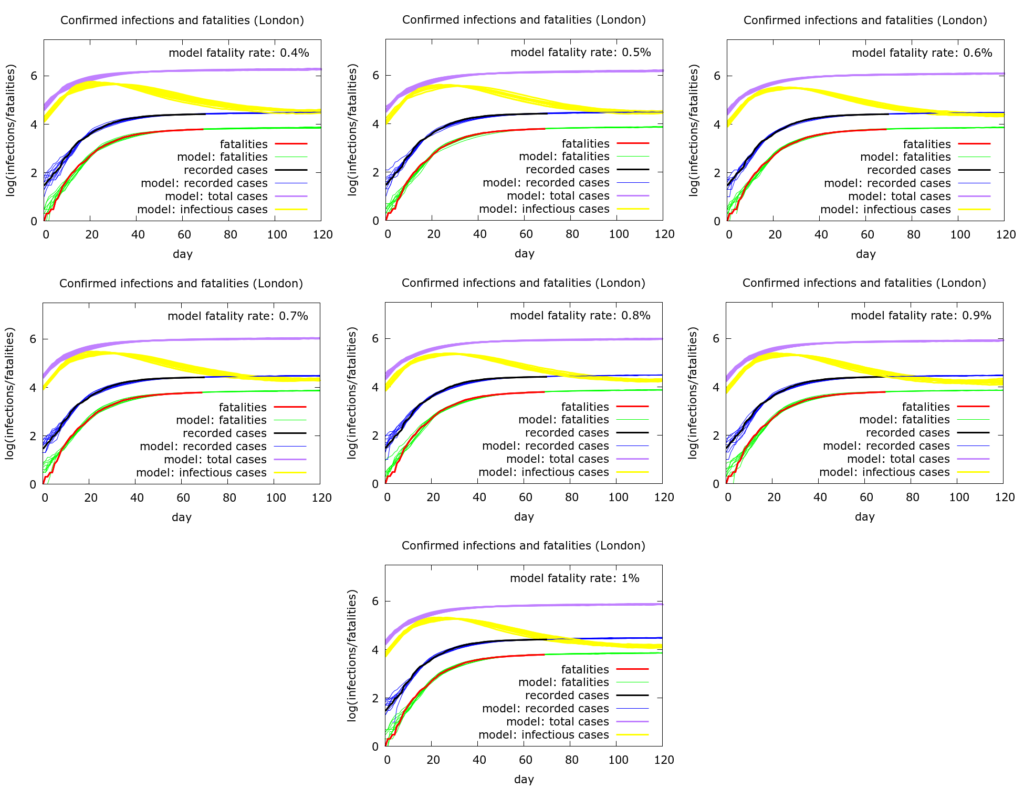
Model predictions. In the case of a fatality rate of 0.8%, in London:
- There have been about 800,000 – 900,000 infections to date (May 15th, purple curves). If the fatality rate is halved to 0.4%, then this would double.
- There are 40,000 to 60,000 currently active infections (May 15th, yellow curves).
- At peak (in the yellow curves), transmissions per day numbered about 25,000 (50,000 if the fatality rate is 0.4%). Peak in daily transmissions occurred around 27th March. In the London Evening Standard article referenced above, peak transmissions were given as 230,000 per day, but it seems that this might be a result of an additional accidental zero. The peak is dated to March 23rd, marginally earlier than here – it is a very flat peak, so this discrepancy is not significant.
- Transmissions (new infections) per day numbered about 10,000 (20,000 if the fatality rate is 0.4%) 18 days after peak – namely about April 14th. This is roughly consistent with the claims in the Evening Standard.
- There are currently about 2000 transmissions per day as of May 15th. (This becomes 4000 if the fatality rate is 0.4%.) This is almost 100 times higher than the figure of 24 transmissions per day given in the Evening Standard. This figure must actually be seen as an extrapolation – for example if lockdown has already significantly loosened it will be higher, but this will not become visible in the testing and fatality data for 12 days or so.
- Testing has consistently captured only about 3% of cases – this is the case detection rate. If the fatality rate is halved to 0.4%, the this becomes only 1.5% of cases or so.
- Fatalities continue to creep up: the average daily deaths decrease, but slowly.
Some notable features of the model parameters used are:
- The initial (pre-mitigation) R0 value used was 7.8. This is much higher than the value of 2.8 quoted in the Evening Standard, suggesting that the model referenced had more rapid dynamics than the one being used here. These variations in R0 are discussed in a twitter thread: https://twitter.com/muradbanaji/status/1258994025907945472.
- People are assumed to be infectious between day 4 and day 14 of infection. Infection is equally likely at any point in this window.
- Average time to death is set as 15 days from infection (this is an average: there’s a distribution on this number).
- Testing/isolation occurs, on average, on day 12 of infection (this is an average: there’s a distribution on this number).
- Prior to lockdown physical distancing already begins: 50% physical distancing starts at the 100th tested case (about March 11th).
- “Lockdown” starts some days later and increases the physical distancing to 70% – it also reduces the total population “available for infection”. But after 10 days of lockdown, this available population increases by a constant amount per day – a “leak”.
Conclusions. There has been progress in London. A few hundred transmissions per day is a tiny fraction of those at peak. But this figure is uncertain, and is itself a function of lockdown. There is still a significant pool of infection – at least a few tens of thousands, and transmissions could rapidly increase with easing of lockdown. It is not transmissions per day in themselves, but the pool of active infections which really matters, and this is still large. Easing of restrictions would be expected to increase transmissions significantly.
Appendix. For completeness here are the parameter values used to generate the 7 plots in Figure 1. Note that a scaling was applied to speed up computations – all populations appear at one tenth of their value, and death rates are multiplied by 10. These values are corrected when plotting the graphs.
number_of_runs 10
death_rate 4.0, 5.0, 6.0, 7.0, 8.0, 9.0, 10.0
geometric 1
R0 7.8
totdays 150
inf_start 4
inf_end 14
time_to_death 15
dist_on_death 6
time_to_recovery 20
dist_on_recovery 6
initial_infections 10
percentage_quarantined 11
percentage_tested 15, 18.75, 22.5, 26.25, 30,33.75, 37.5
testdate 12
dist_on_testdate 6
herd 1
population 900000
physical_distancing 1
pd_at_test 10
pdeff1 50
haslockdown 1
lockdownlen 150
infectible_proportion 0.166, 0.1328, 0.111, 0.095, 0.083,0.0738, 0.0664
lockdown_at_test 28
pdeff_lockdown 70
popleak 2000,1600, 1333, 1143, 1000, 889, 800
popleak_start_day 10
sync_at_test 240
sync_at_time 17