(Murad Banaji, 14/06/2020)
Mumbai has a big COVID-19 data anomaly which I’ve discussed before. It’s bigger than ever today.
The basic conclusion is that in Mumbai one of the following has occurred.
- very large scale fatality underreporting;
- a very large drop in infection fatality rate (IFR);
- some combination of (1) and (2).
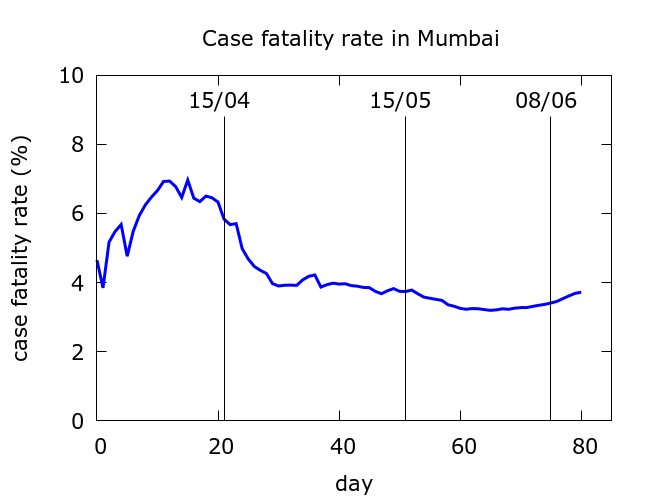
One crude way to see that something is not right is to look at Mumbai’s case fatality rate (CFR). Initial random fluctuation when fatalities are low is normal, but then CFR starts to drop steadily from early-mid April. CFR was dropping as the epidemic raged, and this is not normal. The recent small rise from late May onwards slightly reverses the trend, but has not cancelled out the large unexplained drop.
By contrast, here are CFR curves for London and New York City (data from Wikipedia), both of whose epidemics have wound down.
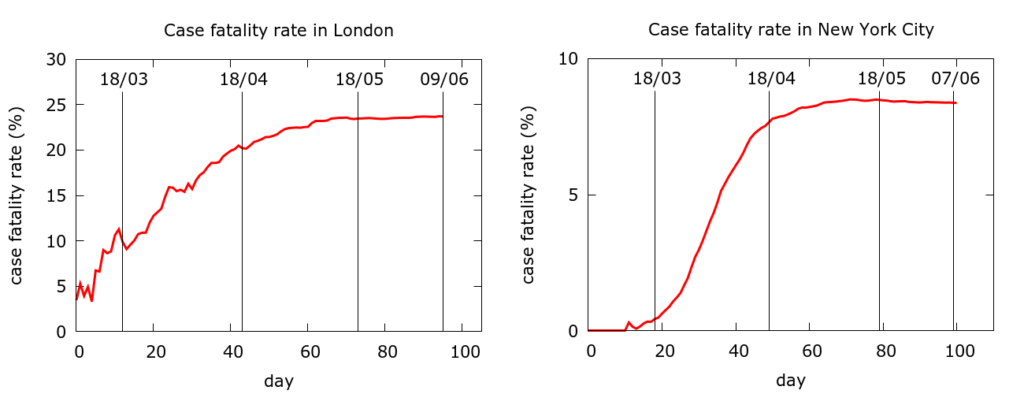
The absolute differences in CFR between London and NYC likely reflect the very different levels of testing. But in neither case do we see any significant fall in CFR during the epidemic. Fatality rates stabilise precisely when infections and deaths wind down, not when they are rising steeply.
While it is a clue that something is amiss, CFR does not give us the scale of the problem. So, let’s clarify what exactly the anomaly is about. The basic idea is that, in general, we expect twice the COVID-19 cases today to mean twice the COVID-19 deaths “a little while” from now. This expectation is premised on case detection and IFR remaining constant. But in Mumbai if we assume constant case detection, then either IFR has very significantly dropped, or a lot of deaths have not been reported. The discrepancy has grown cumulatively over time.
To quantify the discrepancy we need to know: what is “a little while”? Namely, what is the delay between when cases are being recorded (on average) and when deaths are being recorded (on average)? If this “delay” is, say, 8 days then a surge in recorded cases today should imply a surge in recorded deaths 8 days from now. In fact, if IFR is constant, then twice as many deaths today would imply twice as many deaths 8 days from now. Of course, this would be subject to a lot of stochastic fluctuation; but we should certainly see the effect in cumulative data. Let’s call this delay the C-F delay (for case-to-fatality reporting delay).
So the first thing we need to do is guess or infer the C-F delay. Since the goal is to quantify the size of the anomaly, ideally one would would like to use the early data, from before the anomaly starts to develop, to infer this delay.
Mumbai’s early data (25th March to April 14th) is very “clean”. Simple exponential growth in both cases and fatalities as we see in the next figure.
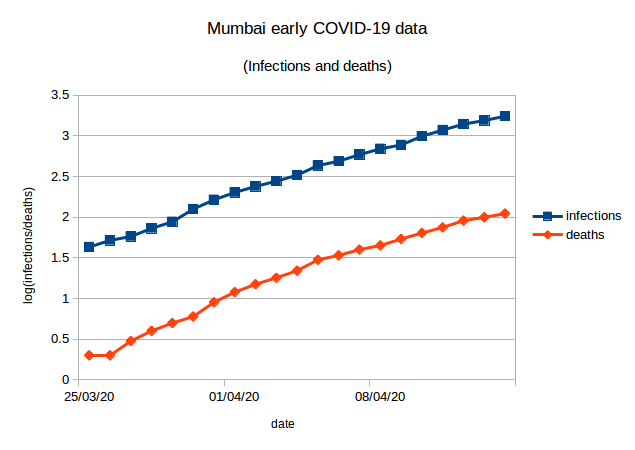
Recorded cases accurately predict recorded deaths whatever C-F delay we choose in a certain range. Put another way, an unfortunate side effect of this clean and featureless data is that it is consistent with:
– shorter delay and higher case detection;
– longer delay and lower case detection.
Crudely speaking, we obtain the lower line (fatalities) in the figure above by shifting the upper line (cases) to the right and down; but how much to the right and how much down cannot be easily determined. To be more precise, if we take data from March 25th to April 14th, we get correlations of above 0.99 between the cumulative deaths and cumulative infections n days earlier where n ranges from 0 to 8. (An aside: I have looked at COVID-19 data-sets where it does seem possible to get a good estimate of the C-F delay by examining correlations.)
So, the early data does not give us a way of estimating the typical delay. Since we can’t reliably determine the delay from the data, we run simulations for four scenarios with the C-F delay ranging through 2, 4, 6 and 8 days. All the simulations assume constant case detection – more about this later. The results of these simulations appear in the next Figure. The agent-based modelling is described at /research/modelling-the-covid-19-pandemic/, with code at https://github.com/muradbanaji/COVIDAGENT. Parameter values are given in the Appendix.
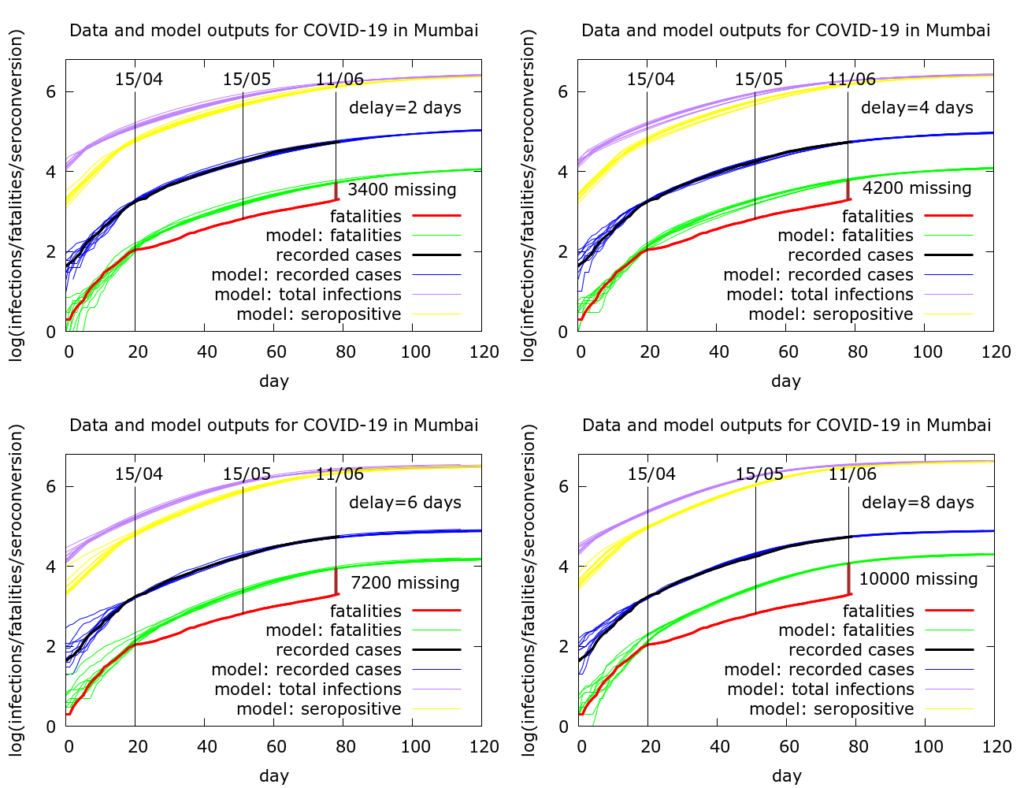
In every case deaths are much fewer than expected. Under the assumptions in these simulations, either deaths are going unreported/unrecorded, or there is a falling infection fatality rate (IFR), or a mixture of these two. The results can be summarised as follows.
- Delay of 2 days: ~3400 deaths missing. Or IFR has dropped by 64% compared to early days.
- Delay of 4 days: ~4200 deaths missing. Or IFR has dropped by 68% compared to early days.
- Delay of 6 days: ~7200 deaths missing. Or IFR has dropped by 79% compared to early days.
- Delay of 8 days: ~10000 deaths missing. Or IFR has dropped by 84% compared to early days.
Can IFR really drop during an epidemic? The answer is maybe. This could have happened in Singapore where, apparently, a lot of COVID cases were migrant workers (relatively young, low fatality). But the numbers of fatalities in Singapore (only 25 so far) are too small to make firm claims that there was really a drop in IFR. Certainly, demography plays a large role in IFR.
Could IFR have dropped dramatically in Mumbai? Are older people somehow being protected more as time goes by? Has there been a big shift in the average age of people with COVID in Mumbai? I can’t find data over time on this, but if the data’s out there, these hypotheses can, in theory, be checked. It has been noted that there are quite a high proportion of COVID-19 deaths of young people in Maharashtra, but this could just reflect the younger demography of India as a whole.
Regarding the estimates for “missing deaths”, it is worth noting that the estimates are based on assuming that case detection is constant and that the C-F delay is constant. If either case detection got worse (there is strong evidence for this) or the C-F delay got less (this is plausible during an epidemic as the level of contact tracing diminishes) then the predictions for missing deaths scale up.
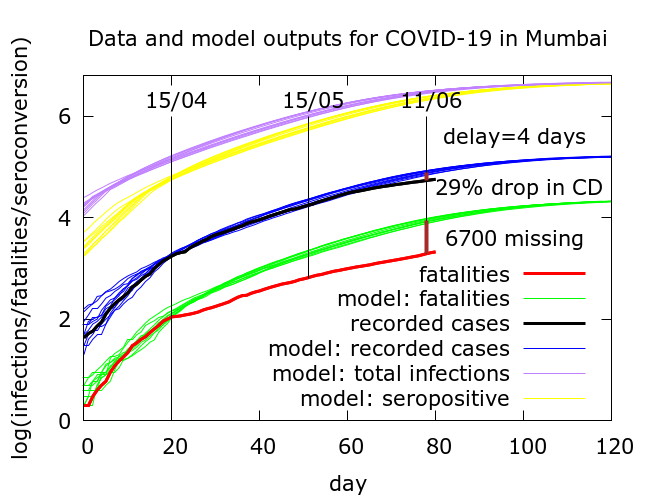
For example, in the figure below is a modification of scenario (2) where now (cumulative) case detection has reduced by about 29% compared to (cumulative) case detection around April 15th. With constant case detection in this scenario we found that there were about 4200 missing deaths (equivalently, a 68% drop in IFR); now there are about 6700 missing deaths (equivalently, a 77% drop in IFR). Parameter values for this simulation are in the Appendix.
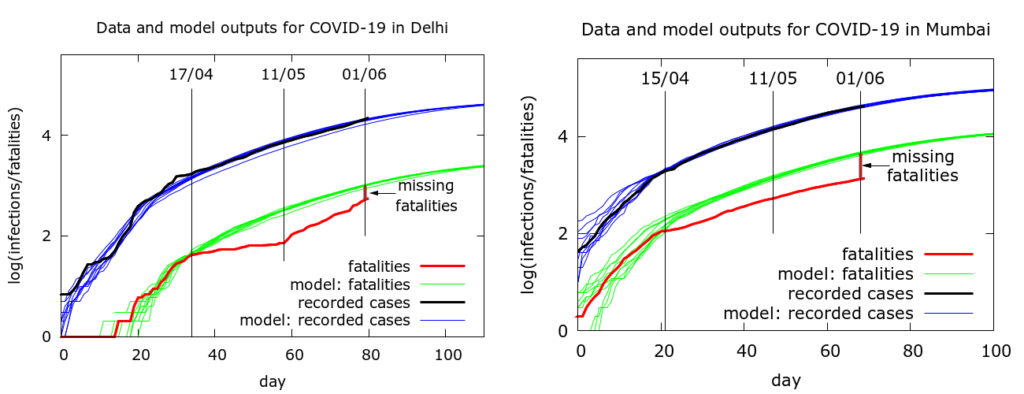
Note that Delhi also had a very similar data anomaly to Mumbai’s – infections were no longer correctly predicting deaths. It turned out that in Delhi the story was quite simple – COVID-19 deaths were not being recorded in the official count. However, once this started to be rectified, the anomaly got smaller. It remains, but is much diminished. The next figure is from an earlier comparison of the two cities. We see in Delhi (left) the growing and then diminishing divergence between expected and obtained fatalities. In Mumbai (right) on the other hand, we had already noted that there is no such “correction” occurring.
To summarise: there are questions about what is happening with COVID-19 data in Mumbai – and Maharashtra more widely – which need to be answered. Improved case detection can be ruled out as an explanation: the rising test positivity makes this implausible. Improved medical care leading to a drop in IFR also seems highly unlikely as the pandemic rages and stories of people struggling to access hospital care abound. This leaves just two plausible possibilities:
- Reduced IFR because of changes in the population in which COVID-19 is spreading. Evidence of this should be visible provided the right kind of data is available.
- Missing deaths. Here there are two sub-possibilities: (i) deaths of patients confirmed to be COVID+ are occurring, but are not being recorded; (ii) deaths are occurring of COVID-19 patients who have not been tested (pre- or post-mortem). Even in the latter scenario, these could be occurring either at home or in hospitals. It is noteworthy, in this context, that there are not (to my knowledge) widespread recent reports of data mismanagement or of deaths of people with comorbidities not being counted in Mumbai. The BMC claims that “all deaths, with co-morbid conditions and testing positive, are being considered as Covid-19 deaths“.
The mystery remains to be solved.
Appendix: model parameter values
Model parameter values for the simulations in the Figure comparing Delhi and Mumbai are given in the link preceding this figure. Parameter values for the five simulations of Mumbai’s data (in the order in which they appear) are as follows. In every case a scaling has been applied to speed up computation: the death rate is set to 10 times its value, and all populations are set to 1/10 of their values.
number_of_runs 10
death_rate 5.0
geometric 1
R0 3.1
totdays 150
inf_start 3
inf_end 10
time_to_death 16, 16, 16, 18
dist_on_death 6
time_to_recovery 20
dist_on_recovery 6
initial_infections 10
percentage_quarantined 4.7, 3.7, 3.7, 3.7, 3.7
percentage_tested 100, 100, 68, 50, 100
testdate 14, 12, 10, 10, 12
dist_on_testdate 6
herd 1
population 2000000
physical_distancing 0
pd_at_test 10
pdeff1 80
haslockdown 1
lockdownlen 150
infectible_proportion 0.1, 0.15, 0.15, 0.15, 0.25
lockdown_at_test 10
pdeff_lockdown 53, 51, 46, 46, 51
popleak 3800, 3500, 4100, 5000, 3500
popleak_start_day 10
sync_at_test 175
sync_at_time 20, 20, 21, 21, 20