(Murad Banaji 02/07/2020)
Some of ICMR’s claims made at a briefing on June 11th were surprising, to say the least, to many people tracking COVID-19 in India or worldwide. Results from the survey were being leaked to the media even before the actual data was shared with ICMR’s own epidemiologists raising the question of who exactly was doing the analysis leading to the leaked results? The data remained unpublished at the end of June, but purported results from the survey continued to be released to the press.
We’ll look here particularly at the figures of 0.73% prevalence in late April and 0.08% infection fatality rate (IFR).
ICMR’s prevalence estimate. First, let’s consider the estimate of 0.73% prevalence at the end of April across the districts surveyed. How was this figure arrived at? Details of the survey are given here, but no details of the analysis leading to the 0.73% figure have been shared to date (June 30th). So, the answer relies on some guesswork. First, since the survey was carried out in mid-May whereas results are quoted for the end of April, it seems that ICMR assumed a delay of roughly two weeks between infection and seropositivity. This appears to be approximately correct for IgG seroconversion, although it would be important to know precisely the window of time over which the regions were surveyed.
More critical than the time to seroconversion is the accuracy of the tests. The kits used are discussed in this paper where figures of 97.9% for specificity and 92.37% for sensitivity are quoted. Now, measured positive results are a sum of true positives and false positives, namely, taking sensitivity and specificity as fractions,
measured positive fraction = (positive fraction)(sensitivity) + (1-positive fraction)(1-specificity).
Setting the positive fraction to 0.0073 (i.e., 0.73%), and using 0.979 for specificity and 0.9237 for sensitivity, gives a measured positive fraction of 0.0276. Based on this calculation we can speculate that in the serosurvey data 2.76% of the tests returned positive, and the prevalence estimate of 0.73% was inferred from this number.
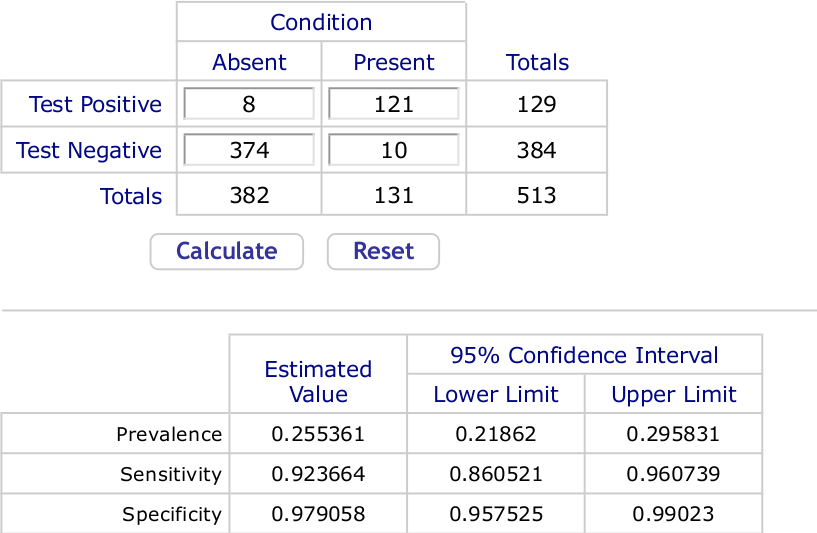
The calculation is formally correct. But even small errors in specificity have a huge impact on the seropositivity estimate. From numbers given in the paper where sensitivity and specificity are given, we can infer that to arrive at the specificity and sensitivity of 97.9% and 92.37% respectively 382 COVID-negative samples were tested giving 8 false positives, while 131 COVID-positive samples were tested giving 10 false negatives. Using an online calculator tailored to such data we obtain 95% confidence intervals of (95.8%, 99.0%) for specificity and (86.1%, 96.1) for sensitivity. A screenshot of the outputs follows.

We can easily calculate that if specificity were lowered from 97.9% to 97.24%, a drop of just 0.0066%, then with 2.76% of samples returning positive, the estimated prevalence would be 0%. Note that 97.24% is well inside the 95% CI on specificity calculated a priori.
Put simply, if the figure of 0.73% prevalence was arrived at as above, then it is highly uncertain, being extremely sensitive to small errors in the presumed specificity of the test. As is generally the case with low prevalence, the accuracy with which we know test specificity is crucial: it is nearly impossible to infer a figure such as 0.73% with any degree of confidence unless we know the test specificity to high accuracy.
ICMR’s IFR estimate. We now come to ICMR’s second estimate of 0.08% for COVID-19 IFR. Although no explanation was given, this figure presumably follows from 0.73% prevalence. However, at first glance, the two numbers do not seem consistent with each other. The estimate of 0.73% prevalence extrapolated nationwide would give approximately 10 million infections on April 30th. On the other hand, on May 21st there were only 3584 recorded COVID-19 fatalities. Based on an average time between infection and death recording (termed I-F delay below) of 3 weeks, this would give an IFR of about 0.036%. Even, with a considerably longer time to death the estimated IFR would not reach 0.08%.
Interestingly, ICMR’s claims of 0.73% prevalence and IFR of 0.08% do become consistent with each other if we assume fatality undercounting. In the approach descibed here [link], an IFR of 0.08% is consistent with 10 million infections by April 30th if we have a C-F delay (defined below) of 7 days; but this approach also tells us that under these assumptions about 1 in 2 fatalities had been missed by April 30th. Thus ICMR’s figures for prevalence and IFR become consistent with each other only if we acknowledge significant fatality undercounting.
