(Murad Banaji, 01/06/2020)
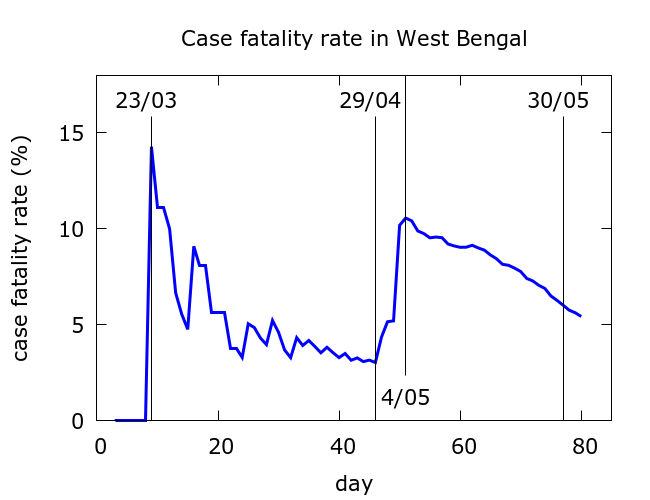
If we plot West Bengal’s case fatality rate (CFR) we immediately see that something unusual has been going on in the state. Probing deeper, the wildly fluctuating CFR of West Bengal (Figure 1) hides a slightly complicated, but now fairly clear, story.

Firstly, it is now well documented that during April West Bengal was, by policy, underreporting COVID-19 deaths of people who also had comorbidities. This led to a precipitous – and entirely artificial – fall in its CFR during April. After pressure it was forced to add these missing deaths back in again. This occurred during the period from 29th April to May 5th and we see the rapid increase in CFR during this period. But after this, CFR started to drop again. Does this mean that there are large numbers of missing COVID-19 deaths in West Bengal again?
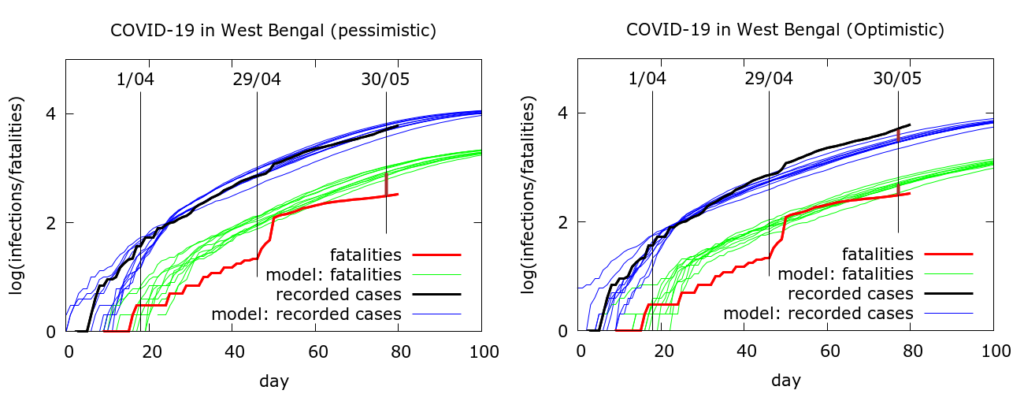
Modelling could provide some insight into the answer. The stochastic, agent-based model used has previously been described at /research/modelling-the-covid-19-pandemic/, with code now at https://github.com/muradbanaji/COVIDAGENT. Simulations from two scenarios are shown in Figure 2.

Suppose that we assume first that testing is picking up a constant fraction of cases. This is the “pessimistic” scenario from the point of view of missing fatalities. In this case we find that about 500 deaths are missing in West Bengal to date. This is seen in Figure 2 (left) as the divergence between red (observed fatalities) and green (expected fatalities). This corresponds to fewer than one in two deaths having been counted. As we see, most of these deaths have “gone missing” during May.
An alternative scenario, which we term “optimistic”, is to attempt to find model parameter to fit the fatality data itself. One such attempt is shown in Figure 2 (right): in this scenario we find there are fewer than 200 deaths missing – namely, about 63% of deaths have been counted. This is the discrepancy between red (observed fatalities) and green (expected fatalities). We also have that case detection in this case has better than doubled compared to case detection in early April when deaths started to be underreported. This is the interpretation of the divergence between blue (recorded infections) and blue (expected values of recorded infections on the assumption of constant case detection). Although the discrepancy appears small, recall that we are plotting on a logarithmic scale, so this discrepancy actually corresponds to more than twice as many cases being detected as expected by the model.
In both simulations we see the dramatic divergence between observed (red) and expected (green) fatalities during the period of fatality undercounting (April). We also see that the correction in early May restore fatalities approximately to what the model expects. There is quite a lot of variation between model runs on account of the stochastic nature of the modelling and the relatively small numbers involved. Full parameter sets used to generate these simulations are given in the Appendix.
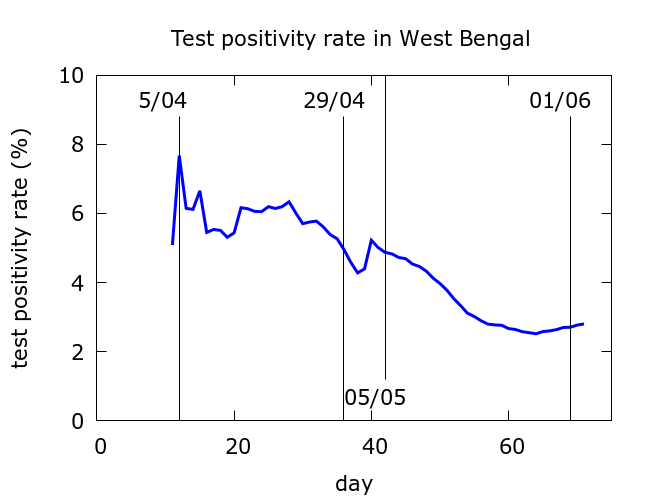
So, which of these scenarios is closer to the truth? We can look to see if case detection might have risen in West Bengal as in the optimistic scenario. Our only hope of getting insight into how case detection might be changing using the available data is to examine the test positivity rate over time (Figure 3). Test positivity has, indeed fallen quite considerably in West Bengal, first during April, and then again, after the correction in fatalities, during May. It is possible that, indeed, case detection has improved significantly and this partly explains the decline in CFR.

In summary, my best guess for what has been happening in West Bengal is the “optimistic” scenario.
- CFR in Bengal fell dramatically in April primarily due to underreporting of fatalities in the official figures. There might also have been a marginal effect due to better case detection.
- Then after the correction to fatalities in early May, CFR fell again, partly due to improved case detection, and partly because there are, again, some missing fatalities.
Going with the optimistic scenario, about one in three COVID-19 deaths is currently being missed and case detection has more than doubled since early April. Although one in 3 missing deaths is an improvement over earlier figures and figures from some other reasons, it is still some cause for concern.
Appendix: parameter values used in the simulations
Parameters are given for the pessimistic and optimistic simulation in that order.
number_of_runs 10
death_rate 0.5
geometric 1
R0 5.0
totdays 150
inf_start 3
inf_end 14
time_to_death 16
dist_on_death 6
time_to_recovery 20
dist_on_recovery 6
initial_infections 2
percentage_quarantined 10
percentage_tested 25
testdate 13
dist_on_testdate 6
herd 1
population 20000000
physical_distancing 0
pd_at_test N/A
pdeff1 N/A
haslockdown 1
lockdownlen 150
infectible_proportion 0.035
lockdown_at_test 4
pdeff_lockdown 65, 69
popleak 400
popleak_start_day 10
sync_at_test 100
sync_at_time 25
