(Murad Banaji, 15/08/2020)
17.6% of 30,054 samples tested in Ahmedabad city were found to have IgG antibodies to SARS-CoV2 in a serosurvey carried out in the city between June 16 and July 11, 2020. The survey covered all 48 wards of the city (but not rural areas of Ahmedabad district). Central and North Zones were found to have higher seropositivity than the city average.
The midpoint of the survey can be taken to be June 29. In 2011, the population of Ahmedabad city was 5.6 million according to the 2011 census. We assume that the city has grown about 7% since then, and take its population to be 6 million. The population of the district as a whole is estimated to be 8 million today. Available COVID-19 fatality figures are for Ahmedabad district.
According to case data, prevalence of COVID-19 in Ahmedabad city is much higher than in the rest of the district. On July 4, areas outside the city had 854 COVID-19 cases out of 21715 in the district, namely 3.9% of the COVID-19 cases in the district, and 55 deaths out of 1475, namely 3.7% of the COVID-19 deaths in the district. On July 23, these proportions had not changed much. Areas outside the city had 1144 COVID-19 cases out of a total of 25173 in the district, namely 4.5% of the district’s cases, and 58 deaths out of 1565, namely 3.7% of the district’s COVID-19 deaths.
We assume that case numbers roughly reflect prevalence, and assume that 5% of infections in the district are from rural areas, while the remainder are from Ahmedabad city. It need not be that case numbers reflect prevalence, as we know from the case of Mumbai, in which case, prevalence estimates are underestimated, and hence the naive IFR estimate could be a slight overestimate.
Estimated prevalence in the district. According to the serosurvey, along with population estimates above, about 0.176*6000000 = 1056000 people in the city have been exposed to COVID-19. Estimated infections in rural Ahmedabad district come to 0.05*0.176*6000000/0.95 = 55579. Since all these figures are very approximate, we add the estimated infections for the city and rural areas, and round to the nearest lakh getting estimated infections in Ahmedabad district at 1.1 million. This gives a prevalence of about 13.75% in the district, somewhat less than the 17.6% estimated for the city.
Naive IFR estimate. There were 1491 recorded COVID-19 fatalities in the district 7 days after the mid-point of the survey, namely on July 6. From this, we get a naive estimate of 1491/11000 = 0.14%. This is comparable to the naive IFR estimate for Mumbai of 0.12%. Note that Mumbai was hit by COVID-19 early, as was Ahmedabad.
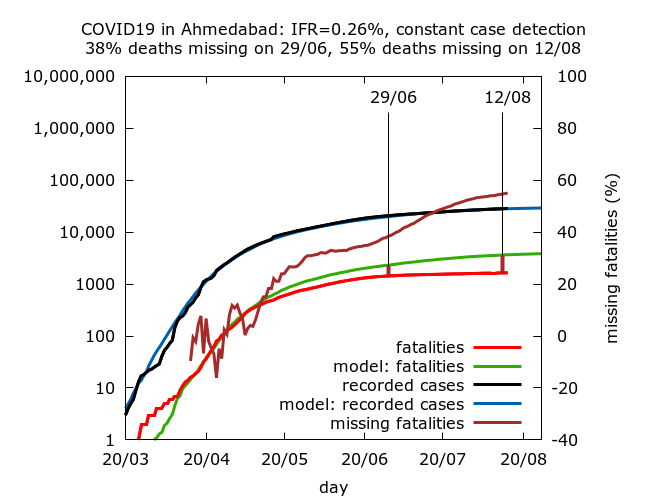
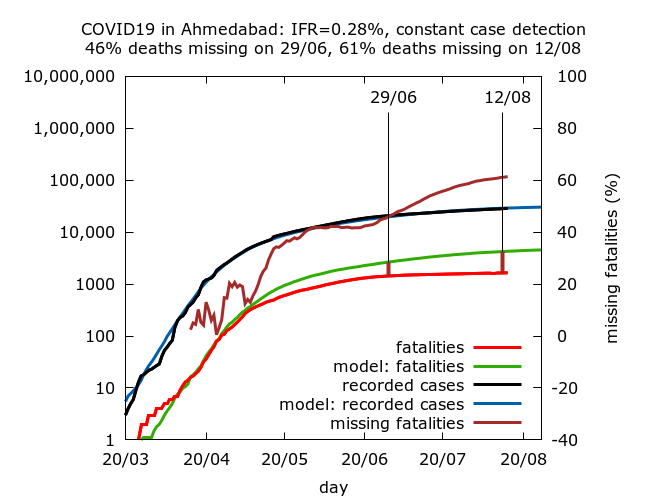
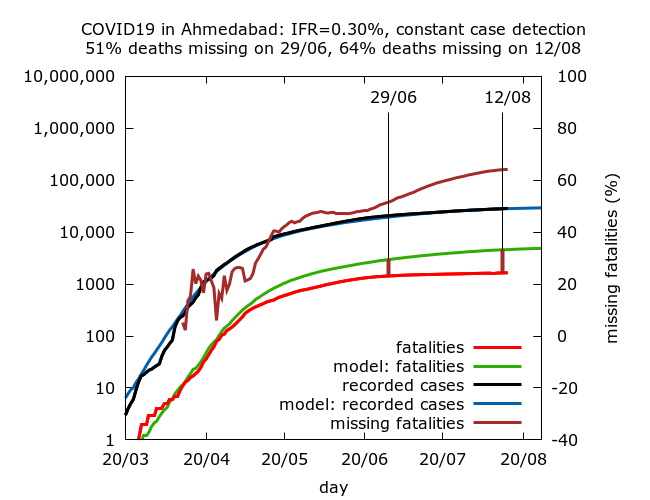
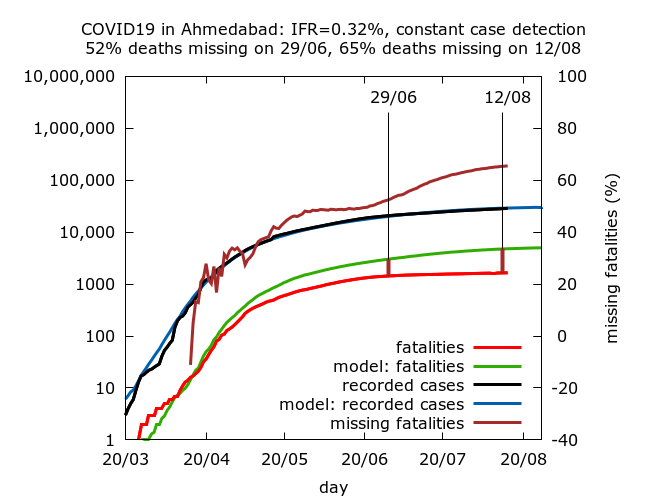
Estimates based on modelling. We now turn to estimates based on agent-based modelling using assumptions of constant IFR, constant C-F delay, and constant case detection through the period of Ahmedabad’s epidemic so far. Technical details and caveats are similar to those for Mumbai here. Unlike in the case of Mumbai, the estimates here do not vary a lot with assumed C-F delay. This is because, at the time of the serosurvey, cases and fatalities in Ahmedabad had slowed considerably.
The following simulations use C-F delays of 3, 5, 7 and 9 days respectively. Full technical details and parameter values are given at the end. They correspond to IFR values of 0.26%, 0.28%, 0.30% and 0.32%. Each IFR value corresponds to missing fatalities (on June 29, the survey midpoint) of 38%, 45%, 51% and 52% respectively. By August 12, these estimates had risen to 55%, 61%, 64% and 65% respectively, indicating that in all simulations, the pace at which fatalities have been going missing has increased throughout July and early August. This trend is also visible as a drop in case fatality rate in the district.
Thus, as for Mumbai (but unlike the case for Delhi), all simulations give some level of missing fatalities ranging, today, from 55% to 65%. We can interpret this as:
Apparent IFR in Ahmedabad district has dropped by 55% to 65% between the early days of the epidemic (March and April) and August.
Some or all of this apparent drop may be a genuine drop in IFR as a consequence of disease spreading in a younger and healthier population (although I have found no narratives to this effect, unlike in Mumbai).
One consistent feature of the simulations, and in line with the case for Gujarat as a whole, is that a greater and greater proportion of fatalities appear to be going missing over time. This trend is clear in Ahmedabad district but not as dramatic as for Gujarat as a whole where similar simulations gave between 62% and 83% of deaths missing in late July.
All of the estimates for IFR and missing fatalities may be underestimates if case detection has fallen, or the C-F delay has decreased over time, although the latter effect would be small since fatalities were not increasing rapidly at the time of serosurvey. They could also be underestimates if there was fatality undercounting in the early days of the epidemic.
Summary
We find modelling estimates for IFR in Ahmedabad are considerably higher than the naive IFR estimate of 0.14%. In other words, modelling suggests that either IFR has genuinely fallen significantly in the district, or deaths have started to go missing in significant numbers, or some combination of these effects has occurred. Although the drop in apparent IFR became noticeable in late April or early May according to the simulations, it has got considerably more pronounced over July and August. This coincides with narrative reports of fatality undercounting in Gujarat (e.g., here for Vadodara and here for Surat).
A best guess for IFR in Ahmedabad based on all the information available would be about 0.3%, corresponding to about half of all deaths missing at the time of the serosurvey, and close to two thirds of deaths missing in the district today. This is comparable to model-based estimates for Mumbai, but somewhat higher than estimates for Delhi.
Technical details of the simulations in the order in which they appear.
Data for cases and deaths in Ahmedabad district from April 26 onwards is taken from https://www.covid19india.org/. Earlier data is taken from newspaper reports or extrapolated where a figure could not be found.
IFR is fixed in advance in the simulations, so there are no confidence intervals on IFR – rather 95% CIs are given for the levels of missing deaths on August 12 and seroprevalence on June 29 in each set of simulations. Each row in the table below is based on between 7 and 9 simulations (because of stochastic fluctuations, some epidemics naturally died out). Parameters were varied using trial and error until a value of 17.6% lay within the 95% CI for seroprevalence on June 29. All values are given to 1 d.p.
| IFR | Missing deaths (29/06) | Missing deaths (12/08) |
| 0.26% | 38.4% (35.0%, 41.4%) | 54.6% (52.4%, 56.7%) |
| 0.28% | 45.9% (43.5%, 48.1%) | 61.1% (59.5%, 62.6%) |
| 0.30% | 51.5% (49.8%, 53.1%) | 64.1% (62.8%, 65.2%) |
| 0.32% | 52.4% (50.8%, 53.9%) | 65.4% (64.4%, 66.3%) |
Parameter values for the simulations (in the order in which they appear):
These simulations use a new version of the model, termed version 0.2, available on the model github site.
number_of_runs 10
death_rate 0.26, 0.28, 0.30, 0.32
geometric -1
R0 2.4
infshp 0.1
totdays 250
inf_gam 1
inf_mid 5.2
inf_tm_shp 9
inf_start 2
inf_end 9
time_to_death 21
dist_on_death -3
time_to_recovery 20
dist_on_recovery -2
initial_infections 10
percentage_quarantined 7.4
percentage_tested 24
testdate 18, 16, 14, 12
dist_on_testdate -3
time_to_sero 14
dist_on_sero -3
herd 1
population 4000000
physical_distancing 0
pd_at_test N/A
pdeff1 N/A
haslockdown 1
lockdownlen 250
infectible_proportion 0.27
lockdown_at_test 120
pdeff_lockdown 35
popleak 42000, 43000, 42000, 43000
popleak_start_day 25
popleak_end_day 80
sync_at_test 2200
sync_at_time 38