(Murad Banaji, 28/07/2020. Note that the original version of this document used an incorrect population estimate for Mumbai – it has been updated with a better estimate, and consequently higher IFR values.)
Background. Partial results of a COVID-19 serosurvey carried out in Mumbai during the first half of July 2020 have recently been reported. The headline claim from the data so far is that 57 per cent of those surveyed in slums and 16 per cent of those surveyed in non-slum areas were IgG seropositive.
Assumptions. Mumbai’s population is taken to be 13.5 million , a little higher than an official estimate by BMC of 12.7 million in 2016. It is assumed that 41.3% reside in slums. From this we can infer seroprevalence in the city to be 0.57(0.413) + (0.16)0.587=0.32933, namely 33%. This would amount to 4.5 million people having antibodies to SARS-CoV2 by the time of the serosurvey. It is assumed that the serosurvey reflects seroprevalence on July 8th 2020, that the time from infection to seroconversion is, on average 14 days, and that the time from infection to death reporting is, on average, 21 days. In the simulations the assumptions are that case detection, IFR and C-F delay (discussed more later) remain constant over time. These assumptions were discussed in an earlier piece in The Wire. The important point is that possible dropping case detection or shortening C-F delay lead to higher estimates of fatality undercounting. In this sense the assumptions are cautious.
Naive calculation. A naive calculation of infection fatality rate (IFR) proceeds as follows. With the assumptions above, seroprevalence on July 8th is reflected in fatalities on July 15th, by which time there had been 5464 recorded COVID-19 deaths in Mumbai. From this we get an IFR of 5464/4455000 = 0.12%. It is important to note at the outset that this naive estimate is not matched by modelling.
Results from modelling. It must be noted that Mumbai’s data strongly indicates large-scale fatality undercounting or a very significant drop in IFR – an effect more pronounced in Mumbai, and Maharashtra generally, than in Delhi. In fact, unlike in the case of Delhi, it is hard to produce plausible simulations of Mumbai’s data which are optimistic in the sense that they assume no “missing” fatalities today. This is despite a data reconciliation process during the latter half of June in which about 1700 “old” fatalities were added into Mumbai’s official count. The data strongly indicates that the reconciliation was far from complete.
The simulations use the latest version of agent-based modelling software COVIDAGENT. Even to obtain simulations with 43% missing fatalities on July 8th we need to assume a very low C-F delay in the early period of just 2 days. The C-F delay is discussed here where an approach to estimating missing fatalities which does not rely on modelling is given.
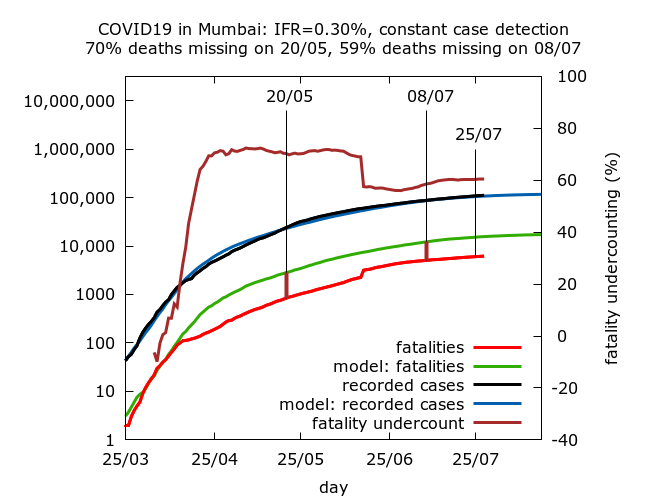
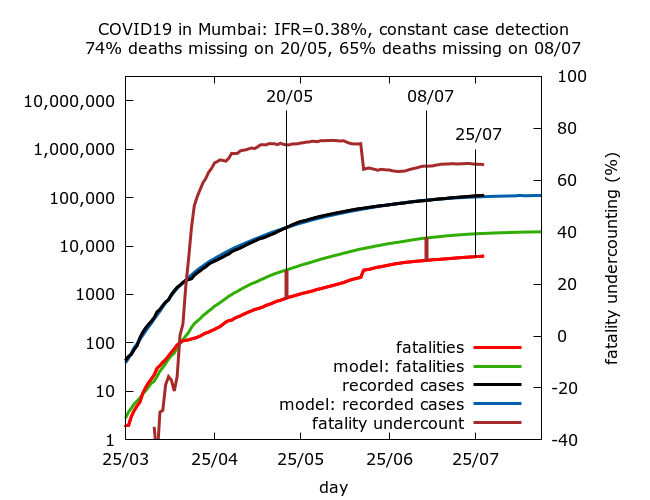
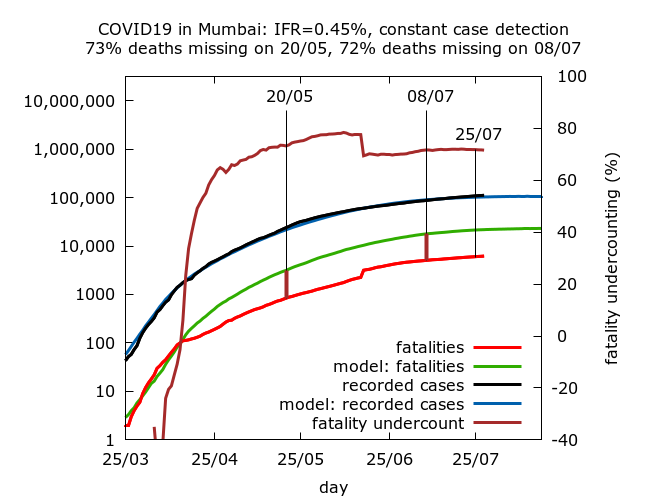
The following simulations have C-F delays of 2, 4, 6 and 8 days respectively. Full technical details and parameter values are given at the end. All assume roughly constant case detection. They correspond to IFR values of 0.23%, 0.30%, 0.38% and 0.45%, with corresponding fatality undercounting (on July 8th) of 43%, 59%, 65% and 72% respectively.
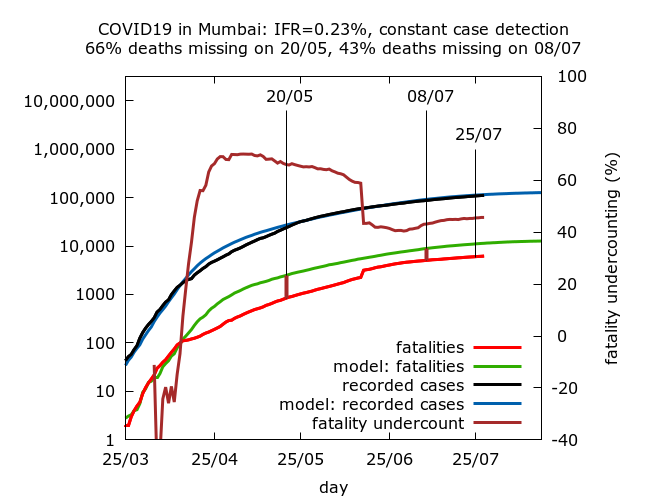
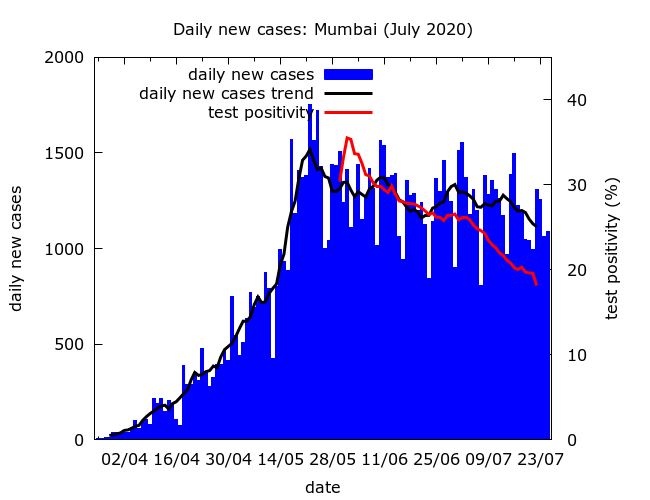
Missing fatalities and prevalence today. All the simulations abovelead to roughly stable levels of missing fatalities today, after the reconciliation during the second half of July; but the actual value of fatality undercounting today varies from about 45% to over 70%. All give prevalence estimates of 39-42% in the city today. This consistency is not surprising because the serosurvey is recent and all the simulations assume that the epidemic is indeed slowly descending from peak as indicated by the daily cases and test positivity.
Missing COVID-19 fatalities. Note that Mumbai’s “missing COVID-19 deaths”, which in the simulations above range between a little under half to almost three quarters of all COVID-19 deaths, are generally interpreted by officials as a genuine drop in IFR in the city. As all the simulations above illustrate clearly, this drop – however you interpret it – was precipitous, mostly occurring over a short period towards the end of April. No plausible explanation has ever been provided for why or how such a dramatic drop in IFR could occur over a short period of time. In the light of subsequent data reconciliations with about 1700 missing deaths in the city added back into the count in late June, it seems much more plausible to interpret the drop as the beginning of a process of fatality undercounting.
The estimated scale of this undercounting depends on the assumed early C-F delay and it is noteworthy that even with implausibly short early C-F delays more than half of all Mumbai’s deaths have been missing at some point during it’s epidemic. I estimate that Mumbai’s official count is missing at least 50% of all its fatalities today; but this should not necessarily be taken to imply deliberate underreporting. It may be that as the disease spread in the slums amongst marginalised communities, an increasing number of COVID-19 patients failed to make it to hospital or to be tested before dying.
It’s worth emphasising that in the case of Delhi’s data, an early C-F delay of 4 days is consistent with no missing fatalities today (the simulations of Delhi’s data reported here use C-F delays of 4, 10 and 12 days). In Mumbai, even an early C-F delay of 2 days gives almost half of all fatalities missing today. In particular, a C-F delay of 4 days in Delhi gives no missing deaths today, while the same C-F delay in Mumbai gives almost 60% missing deaths today! Put simply, Mumbai’s data has a much stronger signature of missing COVID-19 fatalities than Delhi’s.
Summary. Although a naive calculation gives an IFR of 0.12%, plausible simulations consistent with Mumbai’s early data give IFR values ranging from 0.23% to 0.45%. Higher values are possible if we believe that more than 70% of Mumbai’s COVID-19 fatalities had not been recorded by July 8th. There is some overlap between the lower end of these estimates and the upper end of IFR estimates arising from Delhi’s data.
Technical details of the simulations in the order in which they appear. Note that IFR is fixed in advance in the simulations, so there are no confidence intervals on IFR – rather 95% CIs are given for the levels of fatality undercounting and seroprevalence on July 8th in each set of simulations. Each row in the table below is based on between 8 and 10 simulations (because of stochastic fluctuations, some epidemics naturally died out). Parameters were varied using trial and error until a value of 33.0% lay within the 95% CI for seroprevalence on July 8th. All values are given to 1 d.p.
|
IFR |
Fatality undercounting |
Seroprevalence |
|
0.23% |
43.2% (40.8%, 45.3%) |
33.2% (32.4%, 34.0%) |
|
0.30% |
58.6% (57.2%, 59.9%) |
33.5% (32.8%, 34.2%) |
|
0.38% |
65.4% (64.0%, 66.7%) |
33.4% (32.6%, 34.1%) |
|
0.45% |
71.7% (70.5%, 72.8%) |
33.0% (32.3%, 33.8%) |
Parameter values for the simulations (in the order in which they appear):
Note that these simulations use a new version of the model, termed version 0.2, available on the model github site. The main changes involve the use of more reasonable distributions on key parameters, including the individual R0 values. Behaviour of the model at high prevalence is not much affected by the choice of distributions.
number_of_runs 10
death_rate 0.23, 0.30, 0.38, 0.45
geometric -1
R0 3.0
infshp 0.1
totdays 220
inf_gam 1
inf_mid 6
inf_tm_shp 9
inf_start 2
inf_end 9
time_to_death 21
dist_on_death -3
time_to_recovery 20
dist_on_recovery -2
initial_infections 10
percentage_quarantined 7.4
percentage_tested 30, 27, 27, 27
testdate 19, 17, 15, 13
dist_on_testdate -3
time_to_sero 14
dist_on_sero -3
herd 1
population 13300000
physical_distancing 0
pd_at_test N/A
pdeff1 N/A
haslockdown 1
lockdownlen 220
infectible_proportion 0.18
lockdown_at_test 100
pdeff_lockdown 50, 50, 48, 48
popleak 173333, 170000, 145000, 133000
popleak_start_day 18
popleak_end_day 70
sync_at_test 1650
sync_at_time 20