(Murad Banaji, 05/08/2020)
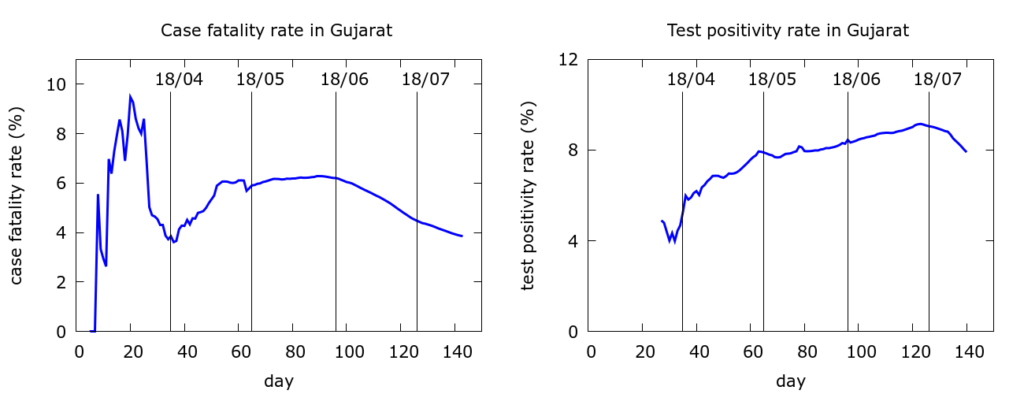
Recently Gujarat has been in the news for systematically failing to include large numbers of COVID19 deaths in its official fatality statistics (see, for example, here, here and here). One sign of unusual behaviour in Gujarat’s COVID-19 data has been the uncertain trajectory of Gujarat’s case fatality rate (CFR), including a steady decline since mid-June without any accompanying signs of ramped up testing. Only in the second half of July has Gujarat’s test positivity started to fall, quite possibly as a consequence of an increase in the use of less sensitive rapid antigen tests which had a dramatic effect on test positivity levels in Delhi.
While we know from multiple reports that fatality undercounting is occurring, can we estimate its scale? Let’s take a look, using modelling, at what different assumptions indicate about the scale of fatality undercounting in the state as a whole. Strictly speaking, what the modelling allows us to estimate is an apparent drop in infection fatality rate (IFR), which can be interpreted either as a drop in IFR or as an increase in death undercounting. The reality could, of course, be a combination of the two effects – if there is any reason to believe that IFR should be falling in the state.
The “optimistic” simulations which give lower percentages of missing deaths correspond to shorter C-F delays. As the C-F delay cannot be reliably estimated from early data, the safest choice is to examine a range of possible values. As discussed in a piece on Maharashtra, the assumptions are conservative in the sense that most would tend to underestimate the scale of missing deaths.
The model simulations are carried out using v0.2 of the stochastic, agent based, simulation software COVIDAGENT. The main assumptions are that in the early days of the epidemic – until about mid-April when there were roughly 30 COVID19 deaths in the state – fatalities were being fully recorded; and that case detection has remained roughly constant throughout the period of the epidemic. The main quantity varied is the so-called case-to-fatality reporting delay (C-F delay), discussed here. This is assumed, however, to remain constant throughout the simulation.
Four example simulations are shown below. C-F delays are 5, 7, 9 and 11 days respectively. Each plot shows an average over 10 simulations and full sets of parameter values are given at the end of this document. These are, of course, only example simulations.
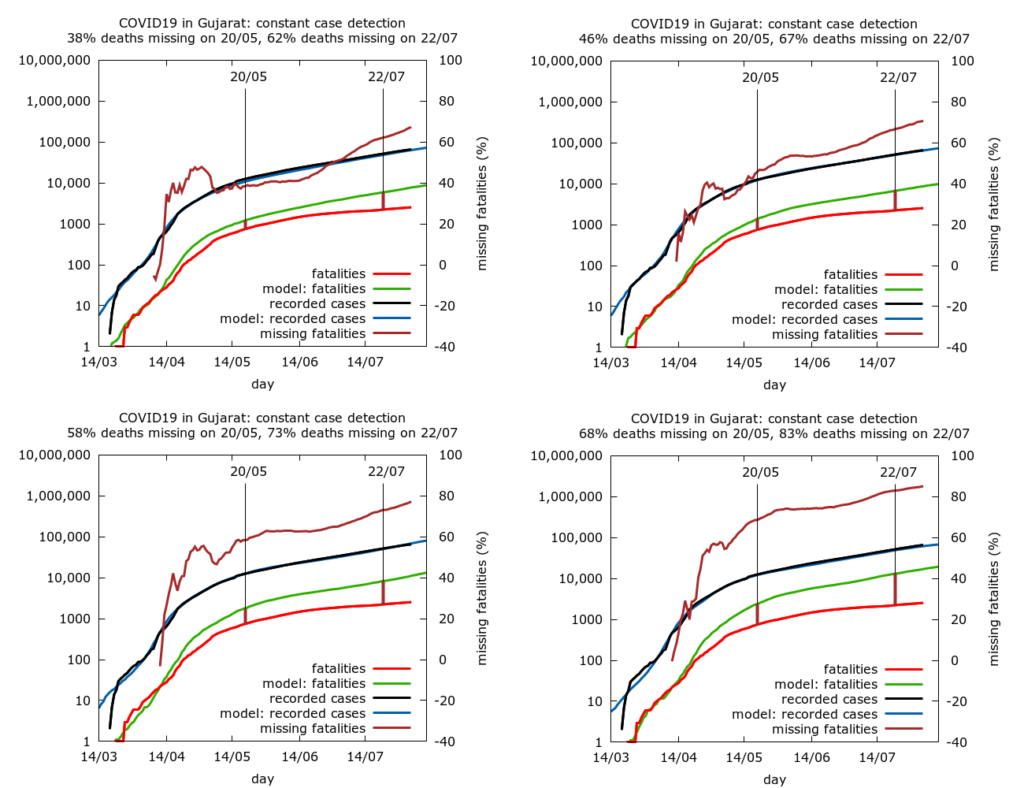
In each case we find that the apparent drop in IFR begins around mid-April, and the proportion of missing deaths increases sharply before plateauing. Missing deaths on May 20th vary between around 40% of total COVID-19 deaths in the most optimistic simulation to just under 70%. All scenarios show a second steady rise in the levels of missing deaths since mid-June. By July 22nd the percentage of missing deaths is between 60% and 80%.
Combined with the narratives of large-scale undercounting, the modelling suggests that this is a growing problem in the state. Even the most optimistic simulations suggests that today upto two thirds of COVID-19 deaths in Gujarat have not been counted. Less optimistic simulations suggest that more than four fifths of COVID-19 deaths in Gujarat could be missing from official figures today.
Parameter values for the simulations (in the order in which they appear):
Note that these simulations use a new version of the model, termed version 0.2, available on the model github site.
number_of_runs 10 death_rate 0.2 geometric -1 R0 4.0 infshp 1.0 totdays 220 inf_gam 1 inf_start 2 inf_end 9 inf_mid 6 inf_tm_shp 9 time_to_death 17, 19, 21, 21 dist_on_death -3 time_to_recovery 20 dist_on_recovery -2 initial_infections 10 percentage_quarantined 10 percentage_tested 15, 13, 10, 6 testdate 12, 12, 12, 10 dist_on_testdate -3 herd 1 population 10000000 physical_distancing 0 pd_at_test N/A pdeff1 N/A haslockdown 2 lockdownlen 19 220 lockdown2startday 30, 30, 31, 32 infectible_proportion 0.01, 0.5 lockdown_at_inf 800 pdeff_lockdown 53, 69 | 54, 66 | 54, 65 | 54, 61 popleak 0, 550000 | 0, 400000 | 0, 630000 | 0, 420000 popleak_start_day 20, 40 | 20, 50 | 20, 50 | 20, 40 popleak_end_day 40, 100 | 40, 100 | 40, 100 | 40, 90 sync_at_test 500 sync_at_time 29