Aims and summary. The goal of this brief model-based exploration is to study the trajectory of the COVID-19 outbreak in Delhi, and see whether there is evidence in the data itself for claims that COVID-19 deaths are being underreported in Delhi. As of 18th May 2020, there had been about 10,000 reported COVID-19 cases in Delhi and 160 reported COVID-19 deaths. We find that the data supports the conclusion that there has been significant underreporting of COVID-19 deaths in Delhi: in fact modelling-based estimates suggest that fewer than one in three COVID-19 deaths have been reported in the capital to date.
The case fatality rate in Delhi. An initial observation involves the case fatality rate (CFR), namely the ratio of total fatalities to total recorded infections expressed as a percentage. The absolute value of the CFR is not very useful by itself, being heavily dependent on testing strategy, and often diverging wildly from the true fatality rate, namely, the infection fatality rate (IFR – the ratio of total fatalities to total infections as a percentage). Nevertheless, changes in the CFR can be a useful indicator of changes in testing strategy, changes in actual fatality, or changes in data recording. The CFR for Delhi is plotted in Figure 1 below. Note that initially the CFR fluctuates because of small numbers of deaths and recorded infections – these stochastic fluctuations are what one would expect in the early days of an outbreak. However, the CFR began a sharp decline around April 17th 2020, when there had been 1707 recorded infections and 42 recorded deaths. This decline began to slightly reverse around May 11th 2020 as seen in Figure 1 below.
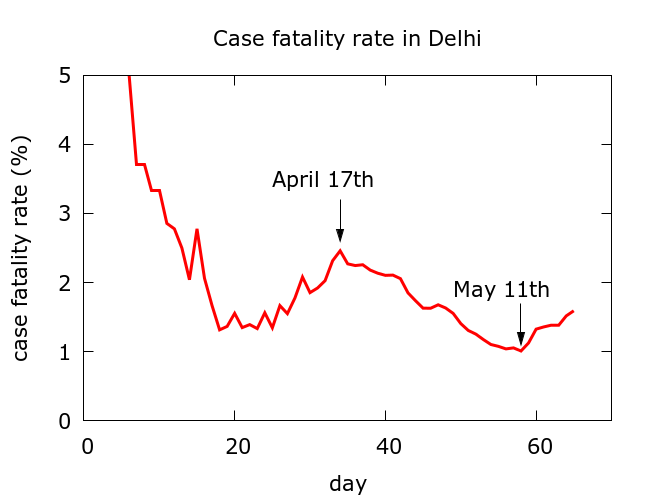
Figure 1. After initial stochastic fluctuations, the case fatality rate experienced a sharp decline beginning on April 17th. Data is from https://www.covid19india.org/.
The simulations use the data at https://www.covid19india.org/ beginning on March 18th 2020 and upto May 18th 2020. The parameter values chosen are optimistic, in the sense that lockdown is assumed to have a significant effect on the likelihood of infection. Moreover, recorded infections are taken at face value and are assumed to be capturing a constant fraction of total infections. An observed slowing of recorded infections some days prior to April 17th is assumed to be a consequence of the change in trajectory of the disease as a result of lockdown, rather than a consequence of any change in testing strategy.
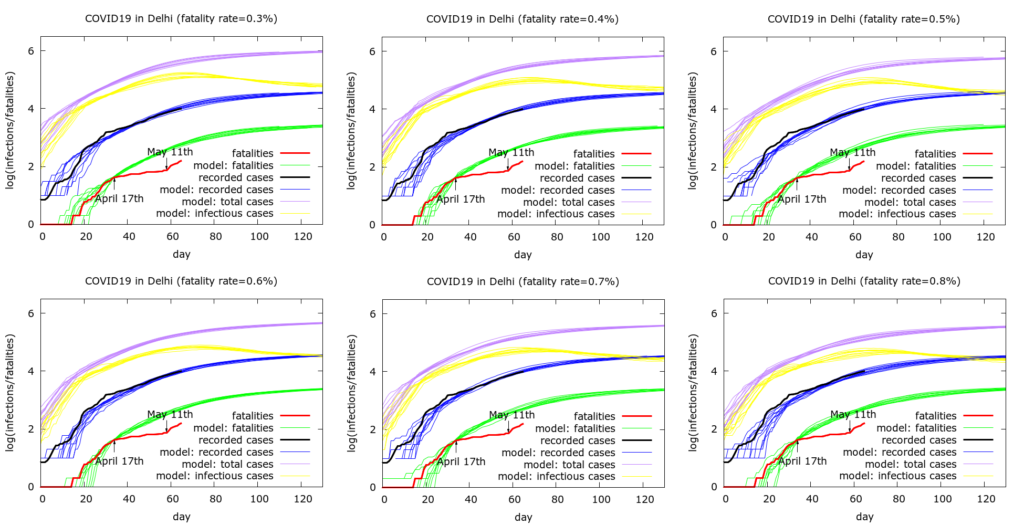
Figure 2. Simulations begin on March 14th. Each simulation consists of ten runs of the model at some fixed set of parameter values given in the Appendix. In the six simulations shown we increase the model fatality rate from 0.3% to 0.8%. Model parameter values are chosen to reproduce approximately the observed testing data. More detail is given in the text.
The mismatch between the green (predicted fatalities) and red (measured fatalities) curves in Figure 1 grows until a correction starts to occur around May 11th 2020, shortly after media reports appeared claiming the Delhi Govt was underreporting COVID19 deaths. A few days later, further reports appeared claiming that there had been 410 funerals in the city following COVID protocols, a considerably greater number than the 115 or so reported deaths at that point. The Delhi government claimed that the sudden increase in reported deaths following May 11th was a consequence of dealing with a backlog of reported cases which, they say, has almost been dealt with.
Interpretation of the results. Figure 2 demonstrates that we are able to reproduce the approximate dynamics of the outbreak while varying assumptions on the IFR (provided we also vary some other model parameters in a systematic way). The process used to obtain the parameters used in the simulations is similar to that described for the analogous study of Maharashtra. In the simulations, it is assumed that mitigation continues to be effective into the future, and hence we see active infections (yellow curves) peaking around the current period.
We use the model to estimate the discrepancy between recorded deaths and modelled deaths as of 18th May 2020. We find model-predicted total deaths in the simulations above to be around 500 at the time that recorded infections reach current values. Thus, with these assumptions, the model predicts that about 350 COVID-19 deaths have been “missed” to date. This prediction is independent of the assumed IFR, namely is approximately the same in all the six simulations shown in Figure 2.
Two alternative explanations for the sudden slowing in fatalities and the drop in CFR can be postulated, much as was done for Maharashtra: (i) infection spreading in a healthier population leading to a genuine drop in the IFR; and (ii) a strong effect of mitigation (namely, lockdown), which does not manifest so strongly in recorded infection data because it is offset by increased testing. As was the case for Maharashtra, these explanations may explain some part of the discrepancy, but are unlikely to explain the bulk of it: the most plausible explanation, consistent with media reports, is underreporting of COVID-19 deaths.
Model estimates of total infection. The model allows us to estimate total and currently active infections in Delhi if we assume a value for the IFR. Model estimates of current infections range from about 150,000 (50,000 currently active) on the assumption of a 0.8% IFR to about 400,000 (150,000 currently active) with a 0.3% IFR. With an intermediate guess of 0.5%, we get about 250,000 infections to date in Delhi of which about 80,000 are currently active. Note that some easing of lockdown is beginning, and with such a significant pool of active infection, cases could easily accelerate again. Thus the model prediction that active infections are currently peaking could prove too optimitic.
Conclusions. There is a strong likelihood that COVID-19 deaths are missing from the current official figures for the outbreak in Delhi, and model estimates suggest that fewer than 1 in 3 COVID-19 deaths have been counted in Delhi to date leading to an artificially low case fatality rate. This conclusion is consistent with reports of a far greater number of burials following COVID-19 protocols than official recorded COVID-19 deaths.
The conclusion is also consistent with the suggestion that COVID-19 prevalence is much higher in Delhi than would be inferred from the reported deaths: underreporting deaths leads to underestimation of prevalence by any technique which relies on fatalities. The indirect evidence of high prevalence in Delhi, for example the high proportion of migrants returning from Delhi to other states and testing positive for COVID-19, is consistent with the scenarios given by modelling here.
A final note: the Delhi government have now said that they will no longer test for COVID19 post mortem, suggesting that we should henceforth treat COVID-19 fatality statistics coming from Delhi with even greater scepticism. Appendix. Model parameter values. Some notable features of model parameter values used in Figure 1 are:
- Individuals are infectious between day 4 and day 14 of infection.
- An R0 value of 6.0 is used in the initial phase of infection, prior to mitigation. Taking the lag between beginning of infection and infectiousness into account, a high R0 value is needed to model the early dynamics of the outbreak. Early lockdown, however, rapidly diminishes the effective R0 value.
- The effective R0 value is also reduced somewhat by the assumption that 10% of individuals are subject to quarantine which occurs on day 11 of infection.
- On average, death occurs on day 17 and recovery on day 20 (there are distributions on these parameters).
- Lockdown begins at the 30th test (about March 24th) and leads to 60% physical distancing, and a drop in the total infectible population (the value of this drop depends on the assumptions about fatality rate).
For completeness here are the parameter values used to generate the 6 plots in Figure 1. Note that a scaling was applied to speed up computations – all populations appear at one tenth of their value, and death rates are multiplied by 10. These values are corrected when plotting the graphs:
number_of_runs 10 death_rate 3.0, 4.0, 5.0, 6.0, 7.0, 8.0 geometric 1 R0 6.0 totdays 150 population 1000000 inf_start 4 inf_end 14 time_to_death 17 dist_on_death 6 time_to_recovery 20 dist_on_recovery 6 initial_infections 2 herd 1 percentage_quarantined 10 percentage_tested 40.8, 54.4, 68, 81.6, 95.2, 100 testdate 11 dist_on_testdate 0 haslockdown 1 lockdown_at_test 3 lockdownlen 150 infectible_proportion 0.0117, 0.00875, 0.007, 0.0058, 0.005, 0.004375 pdeff_lockdown 60 popleak 1333, 1000, 800, 667, 571, 500 popleak_start_day 10 physical_distancing 0 sync_at_death 42 sync_at_time 34