(Murad Banaji, 08/02/2020)
This question was brought into focus by the publication of a “dodgy” paper appearing to claim on the basis of modelling that India’s COVID-19 epidemic would ‘end’ in September. Perhaps, in fact, the question should be “Do COVID-9 epidemics ever end?” It seems increasingly that for many of us COVID-19 is here to stay. Outbreaks wax and wane, and infection may be reduced to low levels but still refuse to die out.
This is not to say that elimination cannot occur. New Zealand appears to have achieved elimination, though at the time of writing, one cannot be sure there is no undetected spread. Other countries, such as Vietnam and South Korea may well achieve something similar. But it is fair to say that for many countries, this is a distant dream.
It’s useful to start by thinking about what COVID-19 doesn’t do. Naive modelling of epidemics is often accompanied by pictures which look something like Figure 1.
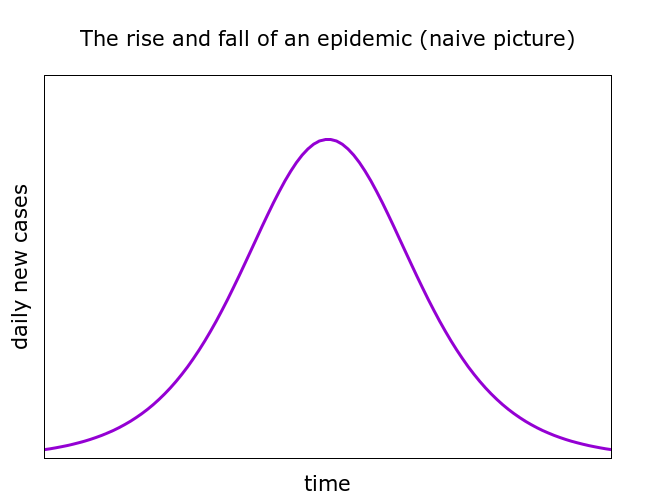
Such pictures suggest some symmetry in the rise and fall of an epidemic. I recently learned from an article in The Caravan that this principle has even got a name – “Farr’s law”. Farr apparently formulated his empirical law in 1840 by studying data from smallpox outbreaks and outbreaks of other infectious diseases.
Let’s first be clear about one thing: COVID-19 is, in general, not obeying Farr’s law. In Figure 2 are the daily new cases for two countries which have been relatively successful in dealing with their COVID-19 outbreaks: Germany and Denmark.
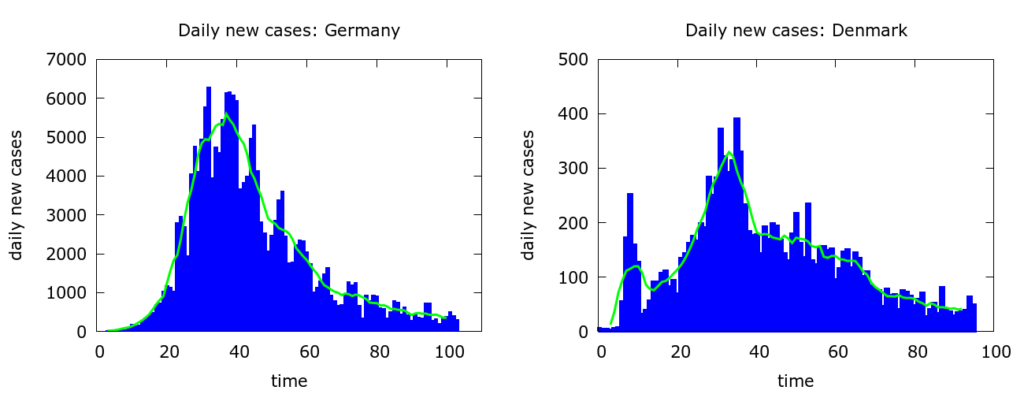
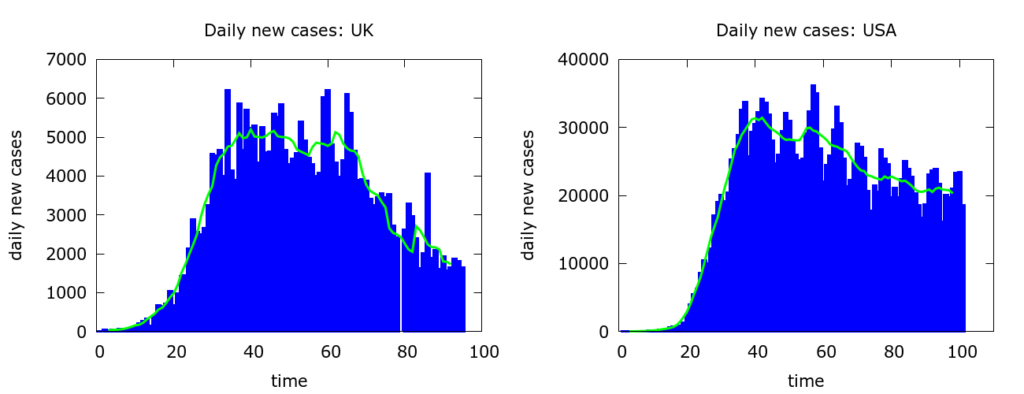
Despite random fluctuations and other effects created by how and when cases get detected and reported, we clearly see the relatively rapid rise and the relatively slow decline in the numbers. The rise is equally steady, but the decline even slower and more uncertain, in countries which have been less successful at mitigation such as the UK and the USA (Figure 3).
In fact, at the time of writing, it is far from clear in many countries which appear to have passed their (first) peak whether the numbers are tailing off towards zero (as in New Zealand), whether there will be resurgence (as in Iran), or whether daily new cases will reach some baseline level around which they simply hover. The same pattern of rapid rise and slow, uncertain fall is found for a number of other COVID-19 outbreaks which have passed peak, both at country and city level.
So why the discrepancy between the real-world asymmetry and the textbook curves? We’ll find, using modelling, that the textbook curves are consistent with a very simple assumption which does not hold for COVID-19 outbreaks. On the other hand the slow tailing off is quite natural behaviour for COVID-19 when accompanied by mitigation measures such as lockdown.
The modelling approach used is stochastic and agent-based. It has been described previously at /research/modelling-the-covid-19-pandemic/, with code at https://github.com/muradbanaji/COVIDAGENT. All parameter values for the simulations below are given in the Appendix.
Underlying the modelling is a plausible assumption which, however, is not self-evident:
Immunity assumption: most people who get infected with COVID-19 and recover are then immune for a significant period of time (i.e., longer than the time-scale of our modelling).
Although this assumption is not uncontroversial, the evidence so far points to it being broadly correct. Moreover, I believe that without this assumption much of the COVID-19 data we see from around the world simply cannot be explained – more on this below. Nevertheless, in making this assumption, we should remember that we know relatively little about the likelihood or duration of post-infection immunity.
Having stated the assumption about immunity, let’s simulate some simple “toy” scenarios for outbreaks.
Herd immunity. First (no surprise here) an outbreak can end because herd immunity develops. A simulation of a simple herd immunity scenario is presented in Figure 4.
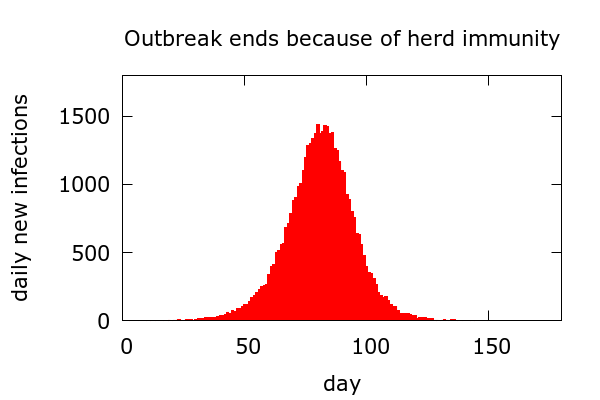
In this scenario we do indeed see the symmetric rise and fall of Farr’s law. Very likely it was the development of acquired immunity underlying the small pox data which led to Farr formulating his empirical law. Anyway, in this scenario disease sweeps through the population, slowing as more and more people become immune. The duration of the outbreak depends on the size of the population, and the outbreak really does “end” in the sense that daily new cases eventually go to zero. At the end of the outbreak, the proportion who have been infected depends on the initial R value and stochastic fluctuation. But my simulations suggest it would not be much below 80% for COVID-19. So, a scenario like this is quite devastating. I should say, at the outset, that this scenario has probably not, so far, unfolded, in any country, city, or perhaps even neighbourhood.
Physical distancing. A second toy scenario for how a COVID-19 outbreak can end is because of the introduction of strong “physical distancing”. This should be read in a general sense to include increased hygiene, mask wearing, and all behaviours which reduce events of the kind which spread infection – including contact tracing followed by isolation. A simulation of a scenario with the sudden introduction of physical distancing is shown in Figure 5.
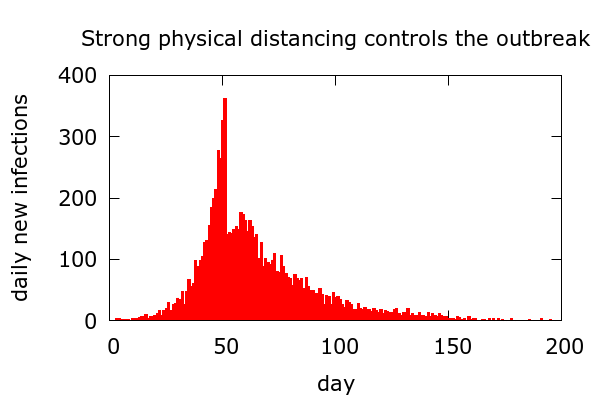
In this artificial scenario, physical distancing suddenly starts (at the first fatality in this simulation), and daily new infections drop immediately. The effect is set to be strong enough to reduce “R” to below 1, so new infections eventually tail off. Of course, in real situations, behaviours do not change this suddenly. Moreover, testing occurs at variable points after infection so any such drop would be smoothed out in confirmed cases data. But still, in such a scenario we should, within a couple of weeks, see a clear drop in daily cases. With plausible levels of physical distancing, infections will tail off more slowly than they rise, and Farr’s law is again violated. A noteworthy feature of this scenario is that it is quite possible that only a small proportion of the total population will have been infected at the end of an outbreak. Of course, for all this to occur, the high level of physical distancing has to be maintained over a prolonged period.
Are either of the above scenarios relevant to COVID-19? Both of the toy scenarios above are very artificial, and I don’t think either explains the evolution of COVID-19 outbreaks in general. Why?
Firstly, regarding the simple herd immunity scenario: seroprevalence studies have shown that COVID-19 outbreaks – even the bad ones such as that in New York City – are not resulting in sufficient immunity to explain the drop-off in infections when outbreak subsides. The same holds for London. Nowhere near enough people were infected to give generalised herd immunity in these cities as a whole; and yet infections tailed off.
Secondly, physical distancing rarely seems to be effective enough to immediately control a COVID-19 epidemic on its own. Many countries – with or without lockdowns – have introduced measures which reduce infection spreading contacts; but in the cases I have looked at, daily new cases may dip temporarily but do not pass peak very soon after mitigation. Namely, R is not immediately brought to below 1. If nothing else, the disease still spreads in families and close communities. (Of course, it might have occurred in some outbreaks that R immediately reduced to below 1 following mitigation – I just haven’t seen any convincing evidence of this to date.)
A more realistic scenario. So, are physical distancing and herd immunity not what cause COVID-19 outbreaks to wind down following mitigation? On the contrary, they are, in combination and with some important tweaks. I tried to explain broadly what happens in lockdown in a recent piece for Scroll. This was focussed on India but the main ideas are more widely applicable.
To begin with, physical distancing (in the general sense) does seem to increase after mitigation measures and cause a reduction in transmission. We see this in many COVID-19 data sets: it manifests as a (temporary) fall in daily new cases. If we plot the logarithm of total cases then it manifests as a change in slope shortly after mitigation. The same holds if we plot fatalities, but with a greater delay. This effect seems to be more or less evident in different countries’ and regions’ data.
But despite this reduction in transmission, in regions I’ve looked at, daily new cases continue to increase for some time – at least three weeks, often more – after the brief fall. The eventual approach to peak is gradual and reminiscent of what happens with increasing immunity. So, reaching and passing peak seems to involve a second part of the story – local herd immunity.
The phrase “herd immunity” is often misunderstood, so it’s important to clarify here. A key effect of lockdown is to localise disease and reduce the effective “infectible” population, by placing barriers to free movement and contact. To put it in a simple-minded, but conceptually useful, way: lockdown divides people into those who belong to a community where there is infection and those who do not. This localisation of disease may occur at the level of households, close social networks, care homes, and so forth. Within the infectible population, herd immunity starts to develop until eventually we see infection levels subsiding. The non-infectible population is, by definition, protected by being removed from view as far as the virus is concerned.
The size of the infectible population, and hence of the outbreak, depends on when mitigation starts. For example, the very late UK lockdown left a much larger part of the population infectible than an early lockdown would have. Modelling indicates that this was behind the UK’s high COVID-19 mortality. In countries with low mortality it seems that early mitigation was successful at keeping the great majority of the population out of view of the virus.
Leak into the infectible population. But there’s more to this story of localisation and herd immunity. I don’t think it is ever realistic to assume that the infectible population is fixed. Rather, there is going to be leakage into this population even in the strictest of lockdowns. All it takes for a whole community to enter the “infectible” category is for one member to acquire infection. So, there’s a competition between developing herd immunity in the infectible population which effectively removes individuals from this population on the one hand, and the addition of new susceptible individuals into the infectible population on the other hand. It is the balance between these competing effects which leads to stabilisation of the disease.
For people familiar with reaction dynamics, we have something analogous to a continuous flow reactor with a supply of new reactant (infectible people) entering the reactor and sustaining the reaction which would otherwise wind down, having used up all the reactant.
In Figure 6 is a simulation of a more realistic lockdown scenario, in which both physical distancing and disease localisation occur and, moreover, there is leak (after a short delay) into the infectible population.
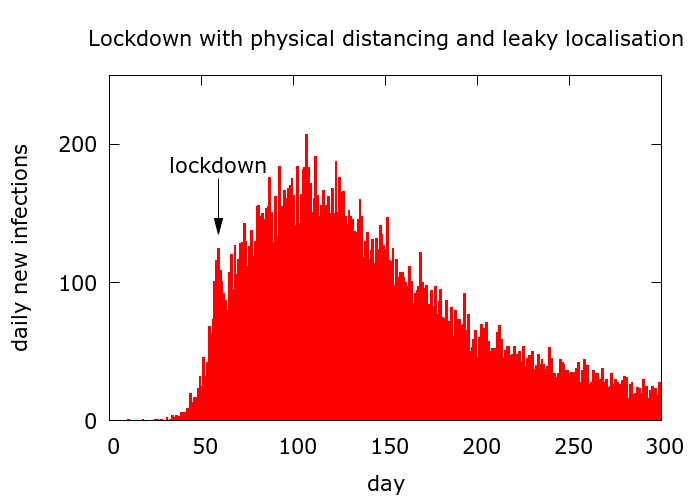
Stabilisation of disease levels is accompanied by R values which hover around 1. The level of infection at which stabilisation occurs is low if the leak is small, and mitigation effective. It may effectively reach zero: this is the goal, but is probably also the exception.
Application to India. India’s COVID-19 epidemic has been slowed but not yet contained by lockdown, and hence is at an earlier stage than current European outbreaks in terms of its evolution. We have not yet reached peak. Lockdown failed to prevent the severe escalation of city outbreaks, and now that lockdown is being eased, the likelihood of disease being exported from hotspots to new areas – “delocalisation” – is increased. The Indian experience shows that heavy-handedness and effectiveness are not synonymous and it is possible that what was achieved at very high cost with national lockdown could have been achieved with more limited and localised measures focussed on areas of relatively high prevalence.
When we model the Indian data, we find that there are many plausible futures for the outbreak, consistent with its evolution so far. These give us insight into what might happen, but no firm answers. We can infer that recent predictions about the end of the epidemic must be based on naive assumptions. In Figure 7 are plots from a simulation whose outputs reasonably match Indian recorded infections to date (taken to be a constant fraction of total infections tested around a particular moment in the disease cycle). It is important to clarify that this is by no means a “prediction”. It is just a simulation consistent with the data so far, and has been chosen to illustrate a point.
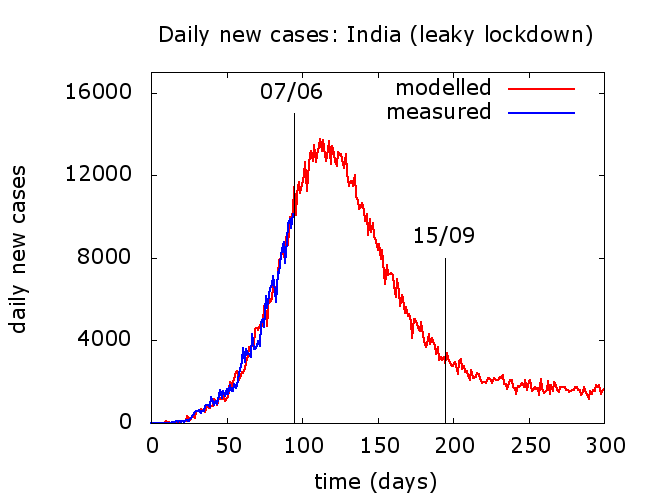
In this reasonably optimistic scenario, peak in daily reported cases is reached a few weeks from now and there is no subsequent resurgence à la Iran. Daily cases decline quite rapidly, but slower than they rose and – here comes the point – eventually plateau. Different choices of model parameters, all consistent with the data to date, change the height and timing of peak, the speed of descent, and the level of the subsequent plateau. Bearing in mind that the numbers plotted above are recorded cases which are at best 5% of true infections, probably much less, stabilisation with a couple of thousand recorded new infections a day may not seem like a “victory”; but it is certainly a lot better than some alternatives.
Summary. Let’s return to the initial question: do SARS-CoV2 outbreaks truly end? Sometimes. Where this has been achieved, or is close to being achieved, it is not because the disease has swept through a population ravaging it so badly that herd immunity is reached. Rather, a combination of stringent and effective measures have reduced transmission and localised the disease to such an extent that remaining infections can be eliminated through rigorous testing, tracing and isolation.
While this might be the “gold standard” in the control of COVID-19, I suspect that the most common scenario will be that infection is beaten back to relatively low levels, but persists at these levels for months, with occasional new surges until, hopefully, a vaccine is found. The “relatively low levels” are going to vary widely between different countries/states/cities. Existing levels of herd immunity in a locality will slow new outbreaks and help disease surveillance, tracing and isolation to do their work. In a large country like India, elimination may be achieved locally, but one should always assume there might be some spread under the radar. And unless borders are truly sealed – an unsustainable state of affairs – there will be new introductions to COVID-free areas.
Basically, dealing with COVID-19 is going to be a long, hard, slog. But badly hit countries – the UK, USA, and Brazil come to mind – serve as a warning that despite the difficulties, bringing infection to low levels and maintaining it there must be a priority. It is increasingly recognised that the damage from high levels of COVID-19 infection should not just be measured in COVID-19 fatalities, but also in the toll on health systems with many people losing access to healthcare, and the long-term health complications which can follow COVID-19 infection. Once a low level of infection is achieved and lockdowns are eased, avoiding unnecessary gatherings and travel, maintaining hygiene, and generally cautious behaviours, will be essential to slowing new outbreaks allowing them to be caught before they reach levels hard to control. But perhaps most important of all will be testing, tracing and surveying coupled with credible modelling to identify developing hotspots, followed by well-rehearsed containment measures to stop the export of disease to new areas.
Appendix: parameter values for the simulations shown
Parameters for the simulations in Figures 4 and 5 respectively. Parameters not shown are set to defaults and do not affect the simulation.
number_of_runs 1
death_rate 0.5
geometric 0
R0 2.5
totdays 200
population 50000, 20000
inf_start 3
inf_end 14
time_to_death 17
dist_on_death 0
time_to_recovery 20
dist_on_recovery 0
initial_infections 2,10
herd 1,0
percentage_quarantined 0
haslockdown 0
physical_distancing 0,1
pddth N/A, 1
pdeff1 N/A, 70
Parameters for the simulation in Figure 6.
number_of_runs 1
death_rate 0.5
geometric 0
R0 3.5
totdays 300
inf_start 3
inf_end 14
time_to_death 17
dist_on_death 6
time_to_recovery 20
dist_on_recovery 6
initial_infections 2
percentage_quarantined 20
percentage_tested 50
testdate 10
dist_on_testdate 6
herd 1
population 10000000
haslockdown 1
lockdownlen 300
infectible_proportion 0.03
physical_distancing 0
pddth 5
pdeff1 10
lockdth 5
pdeff_lockdown 60
popleak 2500
popleak_start_day 20
Parameters for the simulation in Figure 7. A scaling has been applied to speed up computation: the death rate is set to 20 times its value, and all populations are set to 1/20 of their values. True values are shown in brackets.
number_of_runs 1
death_rate 10 (0.5)
geometric 1
R0 4.2
totdays 350
population 4000000 (80000000)
inf_start 3
inf_end 14
time_to_death 19
dist_on_death 6
time_to_recovery 20
dist_on_recovery 6
time_to_sero 10
dist_on_sero 6
initial_infections 10
herd 1
percentage_quarantined 12
percentage_tested 50
testdate 12
dist_on_testdate 6
haslockdown 1
lockdth 23
lockdownlen 350
infectible_proportion 0.1350
pdeff_lockdown 62
popleak 10000 (200000)
popleak_start_day 14
physical_distancing 1
pddth 1
pdeff1 30
sync_at_test 380 (7600)
sync_at_time 38