Murad Banaji (June 3rd 2020)
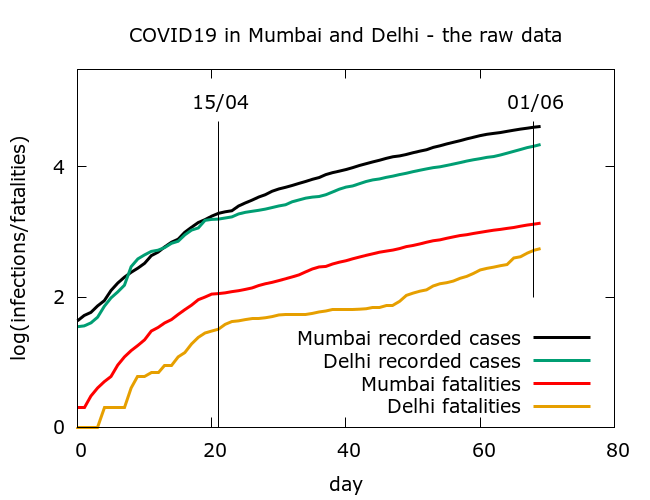
Delhi and Mumbai have similar populations (19M and 18.4M respectively according to google – in reality, who knows!) Both had a couple of hundred recorded cases of COVID-19 by early April, although Mumbai already had more deaths. Both have subsequently been badly hit – they are the two major epicentres of the pandemic in India. There are some further similarities, but also differences in their stories. Modelling-based estimates for the scale of COVID-19 in Mumbai are quite a lot higher than in Delhi. Here are some details.
Initial growth in recorded cases was similar in both Mumbai and Delhi, but deaths in Delhi remained consistently lower than in Mumbai, suggesting that there was better case detection in Delhi. Around mid-April cases slowed in both cities, presumably as a consequence of lockdown starting to have an effect. The slowing was more marked in Delhi than in Mumbai. Deaths started to slow too at around the same time. All of this we see in Figure 1.
Missing Fatalities
An important observation is that in both Delhi and Mumbai deaths slowed faster than infections. Although this is hard to spot in the raw data, it comes out clearly in modelling. We use the stochastic, agent-based model previously described (description at /research/modelling-the-covid-19-pandemic/, code at https://github.com/muradbanaji/COVIDAGENT) to examine the evolution of the disease in both cities.
If we run the model aiming to match recorded infections in both cities then we get outputs as pictured in Figure 2. In both cases, we see that expected deaths (green lines in the model) are considerably higher than observed deaths (red). Parameter values for these simulations are given in the Appendix.
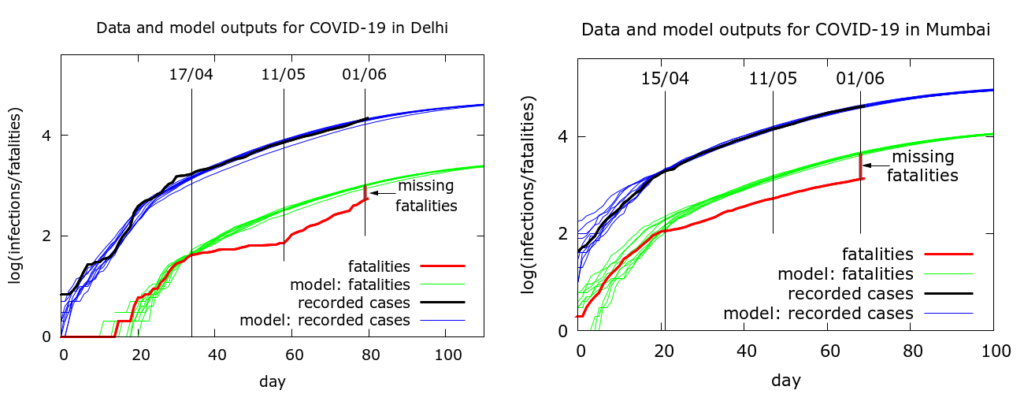
The simulations suggest that undercounting of deaths started in mid-April in both cities.
Fatalities in Delhi. In Delhi there was a specific story of deaths not being added to the official figures – details in this thread. This started to be rectified around May 11th – from then onwards, as seen in Figure 2, the gap between expected and observed deaths decreased in logarithmic coordinates (i.e., the ratio of observed to expected deaths rose). But there are still many missing deaths: the simulations pictured in Figure 2 suggest that to date there have been about 1050 fatalities of which about 1 in 2 have been counted.
Fatalities in Mumbai. In Mumbai, the undercounting seemed to begin with a change in protocol around recording deaths. It is also possible that undercounting occurred because people were unable to access healthcare and hence get tested before dying and/or because people preferred not to report COVID-like symptoms. In any case, there has been no rectification and the gap between expected and observed deaths continues to increase in logarithmic coordinates I.e., the ratio of observed to expected deaths has continued to fall. The simulations pictured in Figure 2 suggest that about 4200 COVID-19 fatalities have occurred in Mumbai to date, of which only about 1 in 3 have been counted.
The estimates for fatalities based on the trajectories of recorded cases rely on an assumption of constant case detection. If we take test positivity as a very rough indicator of case detection, then there is evidence that case detection has been reasonably constant in Delhi since mid-April (Figure 3). In Maharashtra, on the other hand, test positivity has been consistently rising. Data couldn’t be found for testing in Mumbai, so the assumption is that test positivity in Mumbai shadows that of Maharashtra. Below are plots of test positivity for Delhi and Maharashtra. From similar values in mid-April we see a dip and then rise in Delhi, and a steady rise in Maharashtra. This strongly suggests that testing is not able to keep up with rising infections in Maharashtra and, by inference, Mumbai.
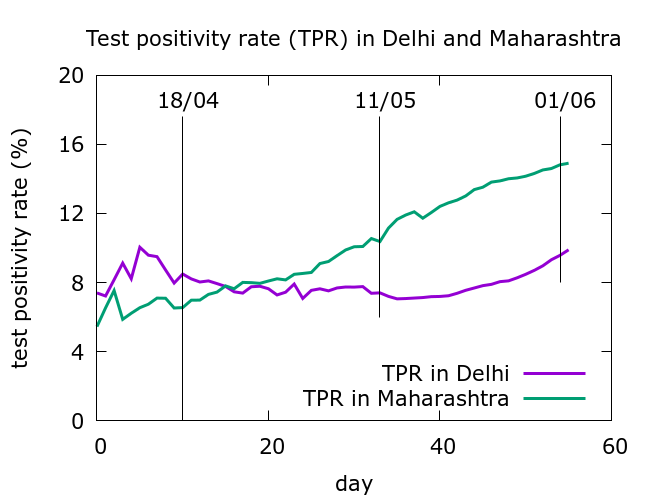
Based on the test positivity figures the estimates for missing deaths in Delhi should be approximately correct, whereas the estimates for missing deaths in Mumbai are conservative. If case detection has actually fallen significantly, there could be many more than the 2800 or so currently estimated. In my analysis for The Wire, I discussed alternative explanations for the mismatch between tests and fatalities, including the possibility that COVID-19 is spreading through progressively healthier or younger populations with a consequent drop in the infection fatality rate (IFR). I believe that although this may play some part, it is unconvincing as an explanation for the very large and growing mismatch between observed and expected fatalities in Mumbai.
Prevalence of COVID-19
If we assume some fixed value for IFR, then we can estimate prevalence in both cities. The following estimates are based on an IFR of 0.5%.
Cases in Delhi. Modelling predicts that there have been about 380000 cases of COVID-19 in Delhi to date. This amounts to only about 2% of Delhi’s population having been infected so far. Moreover, according to the model, about 5.7% of COVID-19 cases in Delhi have been detected to date.
Cases in Mumbai. Modelling predicts that there have been about 1.6 million cases of COVID-19 in Mumbai to date. This amounts to about 8.5% of Mumbai’s population having been infected so far. Thus, according to the model, about 2.6% of cases have been detected to date.
Appendix: data and simulations
All data is taken from the crowd-sourced site https://www.covid19india.org/. Here are the parameter values used to generate the simulations in Figure 2. Parameters are given for Delhi and Mumbai in that order. In the case of Mumbai, because of the higher numbers, a scaling was applied to speed up computations. This is not reflected in the values below which are rescaled to match the values for Delhi.
number_of_runs 10
death_rate 0.5
geometric 1
R0 6.0, 4.2
totdays 150
population 10000000, 20000000
inf_start 4, 3
inf_end 14
time_to_death 17, 16
dist_on_death 6
time_to_recovery 20
dist_on_recovery 6
initial_infections 2, 10
physical_distancing 0
herd 1
percentage_quarantined 11, 3.7
percentage_tested 68, 100
testdate 11, 12
dist_on_testdate 6
haslockdown 1
lockdown_at_test 40, 10
lockdownlen 150
infectible_proportion 0.04, 0.1
pdeff_lockdown 70, 60
popleak 8000, 35000
popleak_start_day 10
sync_at_death 42, N/A
sync_at_test 1750
sync_at_time 34, 20