(Murad Banaji, 15/07/2020).
Update on 24/07/2020. It has now been reported that the serosurvey results from Delhi have reported 23% seropositivity and not 10% as originally reported. This brings IFR estimates down significantly. A new version of this document is available here.
Background. Recently the media reported some results from a COVID-19 serosurvey carried out in Delhi between June 27th and July 5th. In the survey 22,823 samples from residents of Delhi were collected and tested for IgG antibodies to SARS-CoV2. Initial reports suggested that about 10% of samples were found to be positive, although there were also reports of 15% positivity in some papers. Although it was reported that the survey results would be available by July 11th, they do not seem to be available yet (July 15th).
It is currently unclear which of these figures (10% or 15%) is the most reliable, and whether these are raw values or whether they have been corrected to take into account the sensitivity and specificity of the test. If, for example, 10% is a raw value then after correction using the values for test sensitivity and specificity in this paper we would actually get about 8.8% seropositivity. If, on the other hand, 10% is a corrected value, then the raw measured positivity would have been about 11.1%.
Assumptions and their possible effects. In the following calculations, 10% will be taken to be the corrected value of seropositivity in the city. If this value is lower then IFR estimates increase, and vice versa. Delhi’s (i.e., NCT’s) population is taken to be 19 million based on UIDAI figures, although the true value could be higher – if the true population is higher then this would reduce IFR estimates. For simplicity, it is assumed that all seroprevalence data was gathered on July 1st. This could lead to slight underestimation of IFR values, especially if the majority of samples were collected in the later days of the survey. On average, IgG seroconversion is assumed to occur on day 14 after infection with a symmetric distribution (range 7 days) about this figure. The nature of the distribution could have some marginal effect on the estimates: for example a significant proportion of more rapid seroconversions would lead to higher IFR estimates. In the simulations time between infection and death recording is taken to be 21 days.
Naive estimation. First of all, let’s look at a naive calculation, which also turns out to be close to the lower estimate given by modelling approaches. Suppose we assume a time from infection to seroconversion of 14 days, a time from infection to death of 21 days, and also that assume that all COVID-19 fatalities had been recorded by July 8th. Then we can examine the number of fatalities recorded in Delhi on July 8th (namely, 3213), as a proportion of the total assumed infections on June 16th (10% of 19 million, namely 1.9 million) to get an infection fatality rate of 0.17%.
Fatality undercounting. Before turning to modelling, let’s recall the story of Delhi’s missing fatalities. In early May a serious mismatch was noted between hospital data on COVID-19 fatalities and the Delhi government’s official figures. Around May 11th a data reconciliation process began which appears – as far as the data is concerned – to have ended around June 16th. Examined with hindsight, the data suggests that a minimum of 75% of all Delhi’s COVID-19 fatalities were missing around May 11th. This minimum estimate is based on the assumption that all fatalities were indeed added back into the official count by mid-June. It would be fair to call counting only 1 in 4 fatalities very significant fatality undercounting.
Modelling suggests that the data reconciliation considerably brought down the fatality undercounting. But, it is unclear if reconciliation was “complete”. Agent based modelling shows that the data is consistent with complete reconciliation but also with further missing deaths.
Full reconciliation. The most optimistic possibility is that all missing fatalities were indeed added into the official count by June 16th. This date stands out in the data (see plots below) as the end of the reconciliation process. But even if the reconciliation was indeed complete, case data is consistent with the possibility that some relatively small proportion of fatalities started to go missing again after this date. In fact, modelling suggests that either this has happened, or case detection has improved after this date, or some combination of these effects has occurred. Simulations of the two extreme scenarios are shown in the following figure.
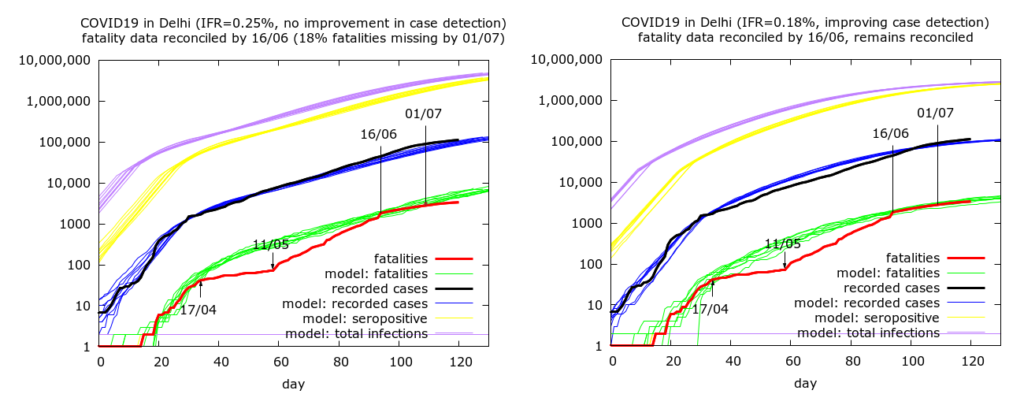
The first scenario where there has been no rapidly improving case detection gives an IFR estimate of 0.25% while the improving case detection scenario leads to an IFR estimate of 0.18%, close to the naive estimate from simple calculation. The higher estimate in the first case arises from the increasing disparity between recorded and actual deaths after mid-June, leading to recorded fatalities being 18% less than predicted fatalities by July 1st (the discrepancy has continued to grow since then). The fact that the second plot corresponds to improving case detection is visible in the as the predicted cases (blue) initially above, and then below, the actual cases (black) after June 16th.
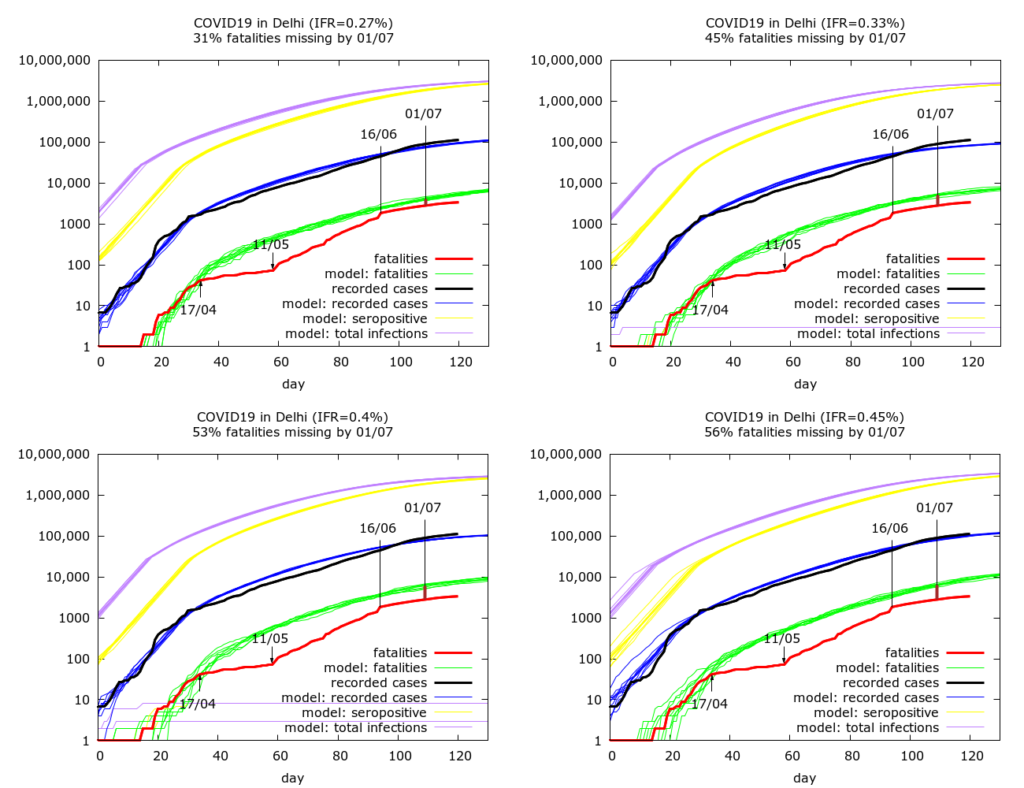
Incomplete reconciliation by mid-June. The the next four simulations assume that the fatality reconciliation was not complete and even by mid-June some COVID-19 fatalities were missing from Delhi’s official count. They do, however, assume improving case detection, consistent with Delhi’s improving levels of testing. We get IFR values of 0.27%, 0.33%, 0.40% and 0.45% corresponding to fatality undercounting (on July 1st) of 31%, 45%, 53% and 56% respectively.
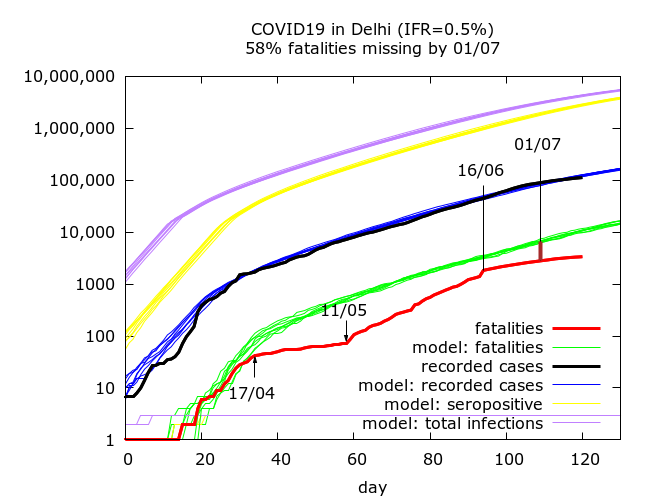
If we allow higher levels of fatality undercounting then we get higher IFR values. We also get higher IFR values if we do not assume improving case detection after mid-June. An example of such a scenario, is shown in the next Figure – here we have, an IFR of 0.5%, no improvement in case detection and 58% fatality undercounting by July 1st.
All the scenarios pictured above give prevalence estimates on July 1st of 12%-16%. The lower prevalence estimates arise from scenarios where the epidemic is stabilising fast, and the recent drop in case fatality rate is driven by greatly increased testing as opposed to missed fatalities.
Summary. To summarise, the data gives rise to plausible IFR estimates of between 0.17% and 0.5%. The most optimistic model simulation – full reconciliation by June 16th – and no further fatalities missed – gives rise to an IFR estimate of 0.18%. At the other end of the spectrum, relatively high fatality undercounting (58% by July 1st), with no great improvement in case detection over the past month can take estimates upto about 0.5%.
Where does the true figure lie? First, it seems fair to assume that case detection has been improving in Delhi based on falling daily cases and increasing daily tests. So we can set aside simulations which are based on no improvement in case detection. With this in mind, I would guess that IFR lies somewhere between 0.27% and 0.4%, corresponding to between 1/3 and 1/2 of fatalities having been missed by July 1st. This would mean that Delhi has done quite well – but not perfectly – when it comes to improving its record on fatality counting; and that IFR of COVID-19 in India is towards the lower end of – but within the broad spectrum of – IFR estimates from data worldwide.
Technical details of the simulations in the order in which they appear. Note that IFR is fixed in advance in the simulations, so there are no confidence intervals on IFR – rather 95% CIs are given for the levels of fatality undercounting and seroprevalence on July 1st in each set of simulations. Each row in the table below is based on between eight and ten simulations (because of stochastic fluctuations, some epidemics naturally died out). Parameters were varied using trial and error until a value of 10.0 lay within the 95% CI for seroprevalence on July 1st. All values are given to 1 d.p.
| IFR | Fatality undercounting | Seroprevalence |
| 0.25% | 18.0% (8.8%, 25.5%) | 10.0% (9.4%, 10.5%) |
| 0.18% | 1.9% (-5.7%, 8.4%) | 10.1% (10.0%, 10.3%) |
| 0.27% | 31.0% (28.0%, 33.9%) | 9.8% (9.6%, 10.0%) |
| 0.33% | 45.3% (41.9%, 46.7%) | 10.0% (9.9%, 10.1%) |
| 0.40% | 53.2% (49.7%, 56.2%) | 9.9% (9.7%, 10.1%) |
| 0.45% | 56.0% (54.0%, 57.8%) | 10.0% (9.8%, 10.1%) |
| 0.5% | 58.0% (56.3%, 59.6%) | 9.9% (9.7%, 10.2%) |
Parameter values for the simulations (in the order in which they appear):
number_of_runs 10
death_rate 0.25, 0.18, 0.27, 0.33, 0.4, 0.45, 0.5
geometric 1
R0 3.2, 3.0, 3.0, 3.0, 3.0, 3.0, 3.0
totdays 180
population 10000000
inf_start 3
inf_end 10
time_to_death 21
dist_on_death 6
time_to_recovery 20
dist_on_recovery 6
time_to_sero 14
dist_on_sero 6
initial_infections 2
herd 1
percentage_quarantined 11
percentage_tested 33, 40, 38, 32, 36, 35
testdate 15, 17, 15, 11, 12, 10, 10
dist_on_testdate 6
haslockdown 1
lockdown_at_test 40, 40, 60, 100, 120, 100, 40
lockdownlen 180
infectible_proportion 0.033, 0.27, 0.47, 0.33, 0.41, 0.5, 0.1
pdeff_lockdown 54, 52.5, 55, 52, 54, 53, 53
popleak 122000, 40000, 30000, 32000, 25000, 30000, 180000
popleak_start_day 21, 21, 18, 25, 12, 20, 20
physical_distancing 0
pddth N/A
pd_at_test N/A
pdeff1 N/A
sync_at_test 1640
sync_at_time 33
syncout 109
scale_at_infs 50000